

Question: please answer as many as you can!! note: it uses matlab. thanks!!! BREAKPOINTS Time RUN OF E IIIIIIIIIIIIIIIIIIIIIIIIIIII Editor - C:Usersja 18051Downloadsp1.m p1. mx +

![mx + disp('----Problem 1----'); v (2 - 4 3 6 0 -5]](https://dsd5zvtm8ll6.cloudfront.net/si.experts.images/questions/2024/09/66f008fdd9ce7_97366f008fd4cd6c.jpg)
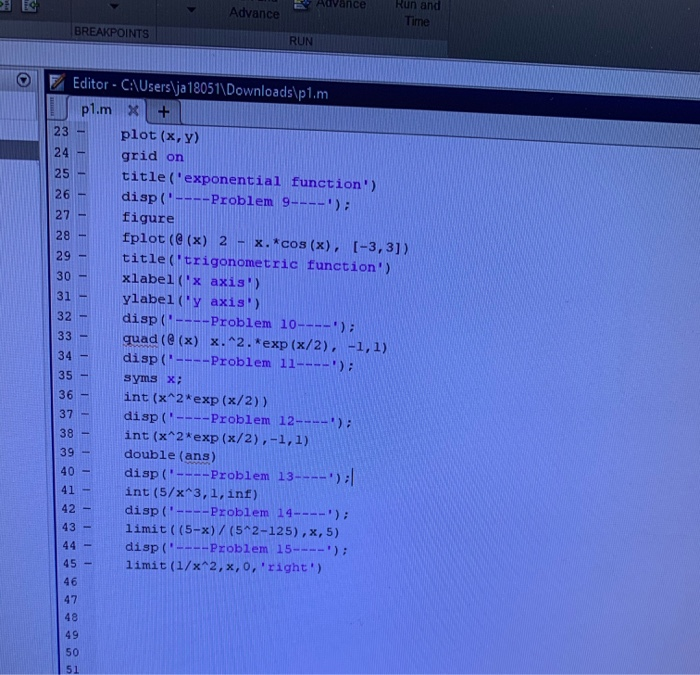
BREAKPOINTS Time RUN OF E IIIIIIIIIIIIIIIIIIIIIIIIIIII Editor - C:\Users\ja 18051\Downloads\p1.m p1. mx + disp('----Problem 1----'); v (2 - 4 3 6 0 -5] disp('----Problem 2----'); A = [1 2 3 ; 456] disp('----Problem 3----'); 1:10 disp('----Problem 4----'); -2:2:8 disp('----Problem 5----'); linspace(-3, 3, 100) disp('----Problem ----'); sum (v) sum (A (:)) *On recent versions of Matlab you can type: sum (A, 'all')! disp('----Problem 7----'); v. 2 A. 2 disp('----Problem 8----'); x - linspace(-2,2, 100); y - exp (sqrt (abs(x))); plot (x,y) grid on title ('exponential function') disp('----Problem 9----'); figure fplot (@(x) 2 - x. *cos(x), 1-3,3]) title('trigonometric function') xlabel('x axis') vlabely axis) Advance Advance" Run and Time BREAKPOINTS Editor - C:\Users\ja 18051\Downloads\p1.m pl.m X plot (x,y) grid on title('exponential function') disp('----Problem 9----'); figure fplot (@(x) 2 - x.*cos(x), [-3,3]) title('trigonometric function') xlabel('x axis') ylabel('y axis') disp('----Problem 10----'); quad (@(x) x. 2. *exp(x/2), -1,1) disp('----Problem 11----'); Syms x; int(x^2*exp(x/2)) disp('----Problem 12----'); int(x^2*exp(x/2),-1,1) double (ans) disp('----Problem 13---- | int (5/x^3, 1, inf) disp('----Problem 14----'); limit((5-x)/(5^2-125),x,5) disp(----Problem 15----'); limit (1/x^2,x, 0, 'right') 1. PROJECT 1: MATH 2242, CALCULUS II, SPRING 2020 Instructions: Write the Matlab script m-file "pl.m" to solve the following problems and submit to the Dropbox on Folio by the due date. You can download and edit the sample file provided on Folio. (1) Create the vector v 12, -4,3,6, 0, -5] (2) Create the matrix A-1438 (3) Create the vector [1..... 10 using colon notation (4) Create the vector (-2,0,2,4,6,8) using colon notation (5) Create 100 points in the interval (-3,3) using linspace() (6) Sum the elements in and all the elements in A (7) Square each of the elements in and all the elements in A (8) Plot the function f(x) = on the interval (-3,3] using ploto (9) Plot the function /(x) = 1 - sin(x) on the interval (-3, 3) using fplot() d e (10) Use the numerical function "quad()" to evaluate: Si (11) Use the symbolic function "int(" to evaluate: fredr. (12) Use "int(" to evaluate: Sie de and find approximate decimal equivalent. (13) Use "int()" to evaluate: dz (14) Compute limg+5 135 (15) Compute lim-0- BREAKPOINTS Time RUN OF E IIIIIIIIIIIIIIIIIIIIIIIIIIII Editor - C:\Users\ja 18051\Downloads\p1.m p1. mx + disp('----Problem 1----'); v (2 - 4 3 6 0 -5] disp('----Problem 2----'); A = [1 2 3 ; 456] disp('----Problem 3----'); 1:10 disp('----Problem 4----'); -2:2:8 disp('----Problem 5----'); linspace(-3, 3, 100) disp('----Problem ----'); sum (v) sum (A (:)) *On recent versions of Matlab you can type: sum (A, 'all')! disp('----Problem 7----'); v. 2 A. 2 disp('----Problem 8----'); x - linspace(-2,2, 100); y - exp (sqrt (abs(x))); plot (x,y) grid on title ('exponential function') disp('----Problem 9----'); figure fplot (@(x) 2 - x. *cos(x), 1-3,3]) title('trigonometric function') xlabel('x axis') vlabely axis) Advance Advance" Run and Time BREAKPOINTS Editor - C:\Users\ja 18051\Downloads\p1.m pl.m X plot (x,y) grid on title('exponential function') disp('----Problem 9----'); figure fplot (@(x) 2 - x.*cos(x), [-3,3]) title('trigonometric function') xlabel('x axis') ylabel('y axis') disp('----Problem 10----'); quad (@(x) x. 2. *exp(x/2), -1,1) disp('----Problem 11----'); Syms x; int(x^2*exp(x/2)) disp('----Problem 12----'); int(x^2*exp(x/2),-1,1) double (ans) disp('----Problem 13---- | int (5/x^3, 1, inf) disp('----Problem 14----'); limit((5-x)/(5^2-125),x,5) disp(----Problem 15----'); limit (1/x^2,x, 0, 'right') 1. PROJECT 1: MATH 2242, CALCULUS II, SPRING 2020 Instructions: Write the Matlab script m-file "pl.m" to solve the following problems and submit to the Dropbox on Folio by the due date. You can download and edit the sample file provided on Folio. (1) Create the vector v 12, -4,3,6, 0, -5] (2) Create the matrix A-1438 (3) Create the vector [1..... 10 using colon notation (4) Create the vector (-2,0,2,4,6,8) using colon notation (5) Create 100 points in the interval (-3,3) using linspace() (6) Sum the elements in and all the elements in A (7) Square each of the elements in and all the elements in A (8) Plot the function f(x) = on the interval (-3,3] using ploto (9) Plot the function /(x) = 1 - sin(x) on the interval (-3, 3) using fplot() d e (10) Use the numerical function "quad()" to evaluate: Si (11) Use the symbolic function "int(" to evaluate: fredr. (12) Use "int(" to evaluate: Sie de and find approximate decimal equivalent. (13) Use "int()" to evaluate: dz (14) Compute limg+5 135 (15) Compute lim-0
Step by Step Solution
There are 3 Steps involved in it

Get step-by-step solutions from verified subject matter experts