

Question: please answer as much as you can 4. {30 points) For the population of people in the workforce in 1976, WAGEI data was used to
please answer as much as you can
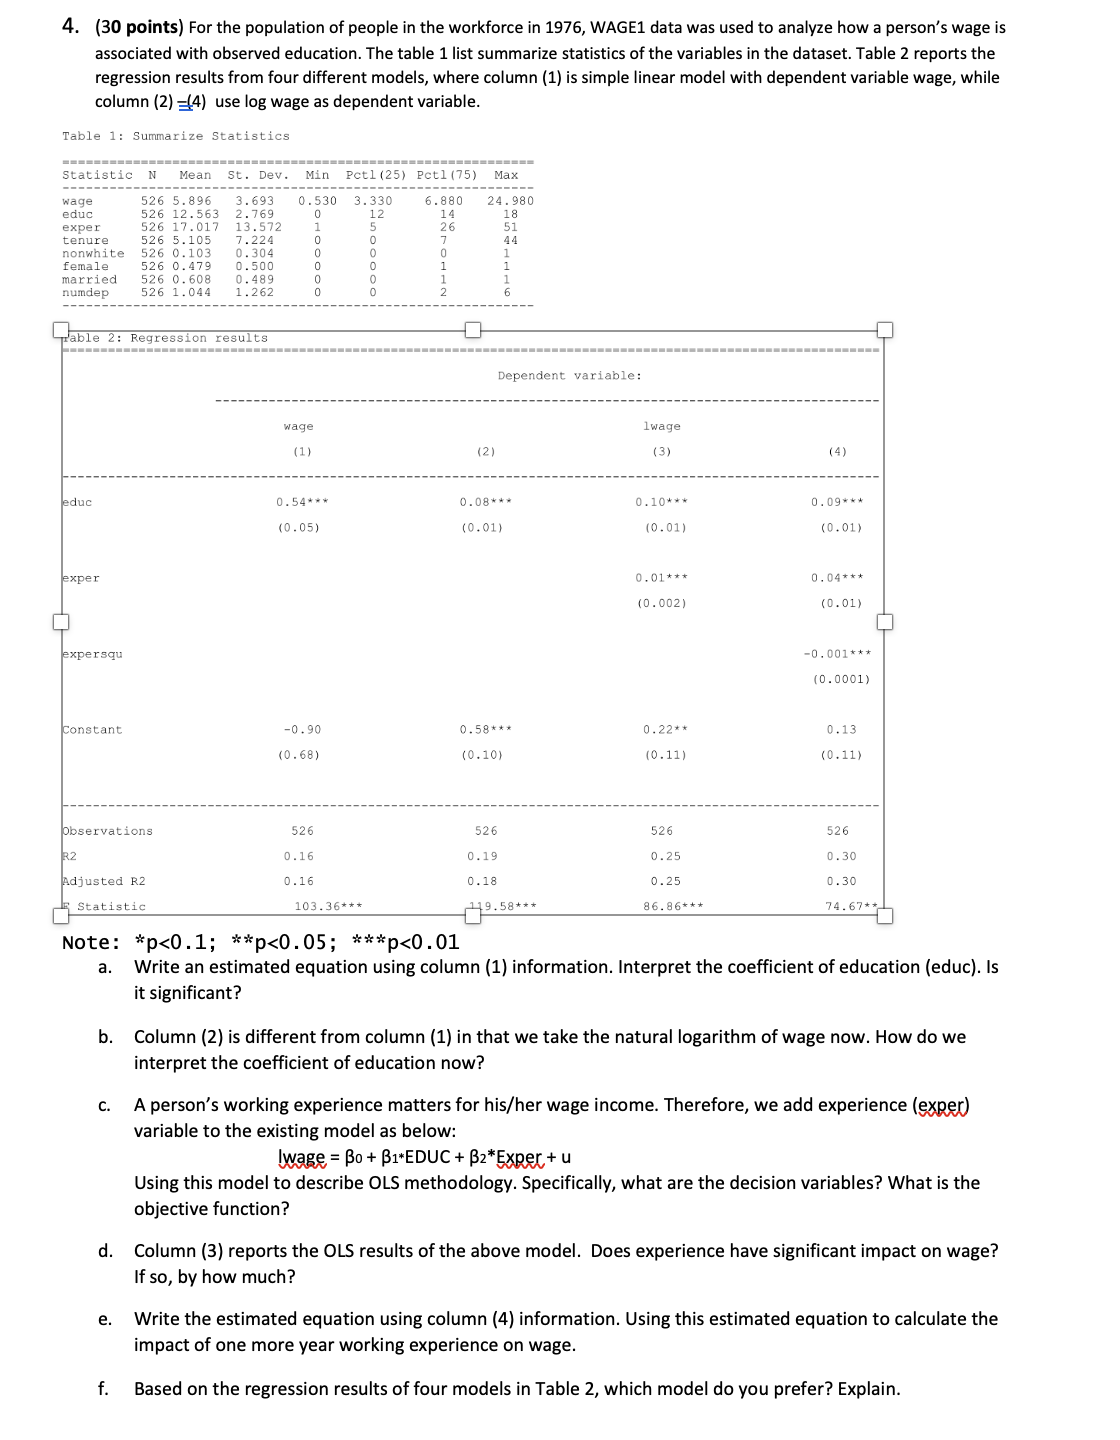
4. {30 points) For the population of people in the workforce in 1976, WAGEI data was used to analyze how a person's wage is associated with observed education. The table 1 list summarize statistics of the variables in the dataset. Table 2 reports the regression results from four different models, where column (1) is simple linear model with dependent variable wage, while column {2} 5\"} use log wage as dependent variable. Table 1: Summarize Statistics wage 526 5.896 3.693 0.530 3.330 6.880 24.980 educ 526 12.563 2.169 0 12 14 18 exper 526 11.01? 13.572 1 5 26 51 tenure 526 5.105 ?.224 0 D T 44 nonwhite 526 0.103 0.304 0 D 0 1 female 526 0.479 0.500 0 D l l married 526 0.608 0.489 0 0 l l numdep 526 1.04! 1.262 0 D 2 5 able 2: RegressiOD results Dependent variable: 0.54"* (0.0M {0.0021 -0.001'** (0.0001) observations 0.25 "ojusted R2 .16 0.25 L Statistic 103.36*** 86.86*** Note: *p
Step by Step Solution
There are 3 Steps involved in it

Get step-by-step solutions from verified subject matter experts