

Question: Please answer as quickly as possible thank you. Given are data for two variables, x and y. 6 11 15 18 20 13 21 30
Please answer as quickly as possible thank you.
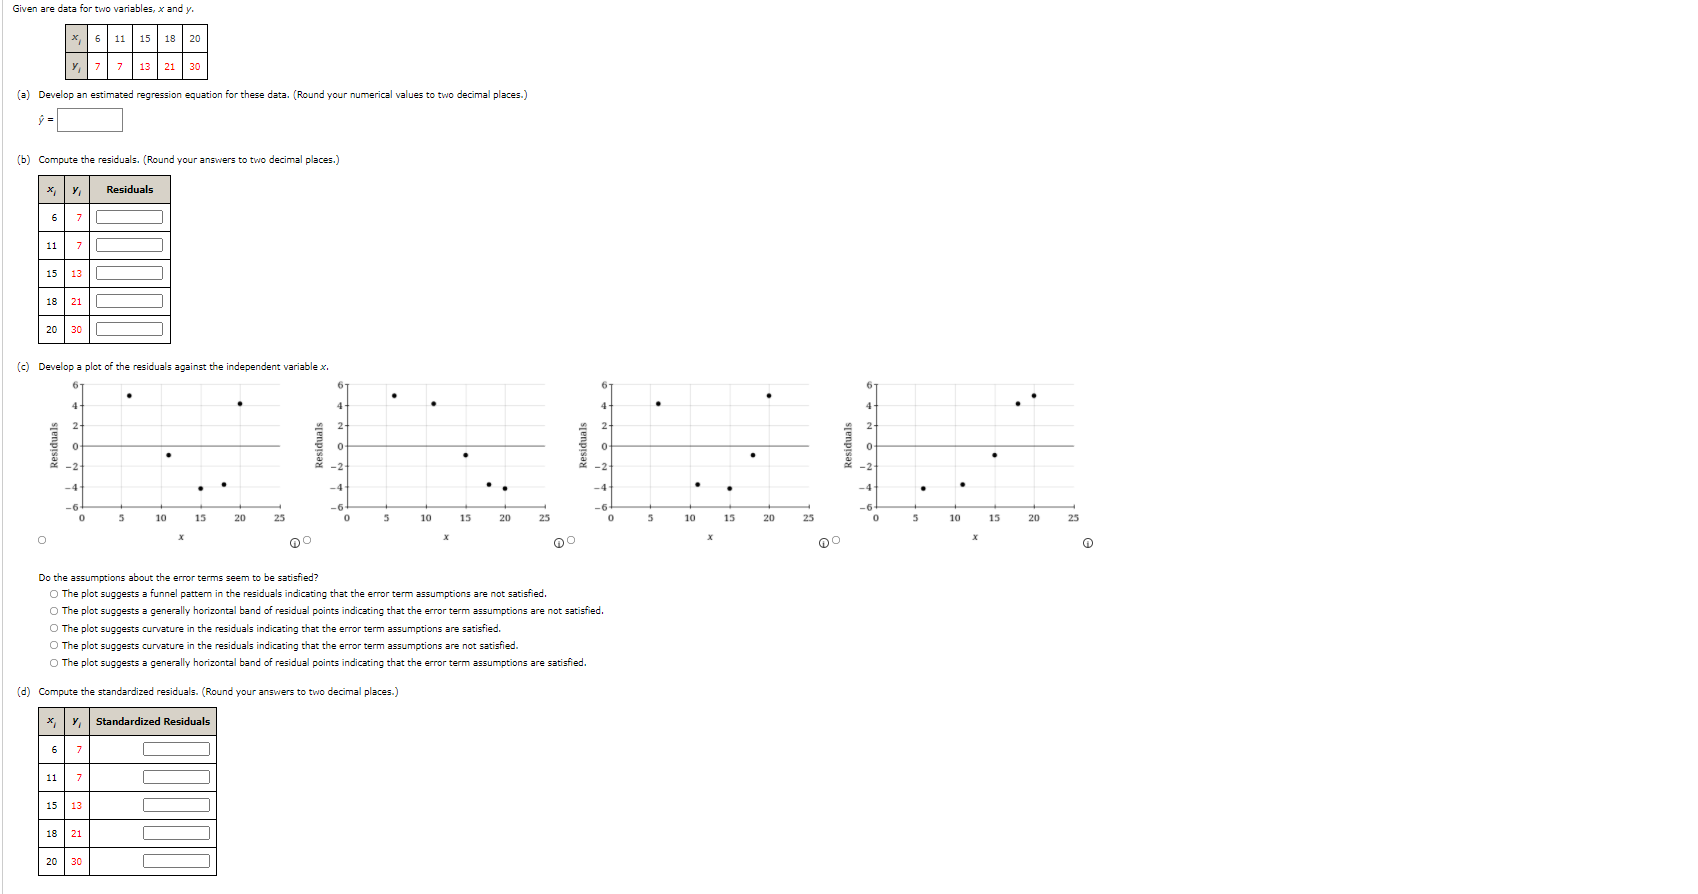

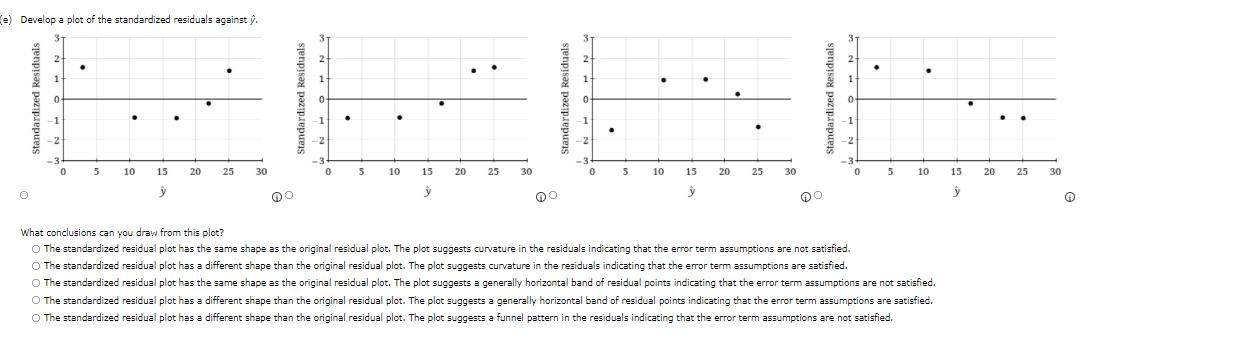
Given are data for two variables, x and y. 6 11 15 18 20 13 21 30 (@) Develop an estimated regression equation for these data. (Round your numerical values to two decimal places.) (b) Compute the residuals. (Round your answers to two decimal places.) Residuals 6 1 15 13 18 21 20 30 (c) Develop a plot of the residuals against the independent variable x. 6T 9 ANONAG Residuals Residuals Residuals Residuals atNONA 10 15 20 25 10 15 20 25 10 15 20 10 15 20 25 O Do the assumptions about the error terms seem to be satisfied? O The plot suggests a funnel pattern in the residuals indicating that the error term assumptions are not satisfied. O The plot suggests a generally horizontal band of residual points indicating that the error term assumptions are not satisfied. O The plot suggests curvature in the residuals indicating that the error term tions are satisfied. O The plot suggests curvature in the residuals indicating that the error ter ons are not satisfied. O The plot suggests a generally horizontal band of residual points indicating that the error term assumptions are satisfied. (d) Compute the standardized residuals. (Round your answers to two decimal places.) Standardized Residuals 6 11 15 13 18 21 20 30(e) Develop a plot of the standardized residuals against y. N G OHNU Standardized Residuals Standardized Residuals Standardized Residuals Standardized Residuals N M -2 -2 -3 -3 -3- -3 5 10 15 20 25 30 5 10 15 20 25 30 5 10 15 20 25 30 5 10 15 20 25 30 O What conclusions can you draw from this plot? O The standardized residual plot has the same shape as the original residual plot. The plot suggests curvature in the residuals indicating that the error term assumptions are not satisfied. O The standardized residual plot has a different shape than the original residual plot. The plot suggests curvature in the residuals indicating that the error term assumptions are satisfied. O The standardized residual plot has the same shape as the original residual plot. The plot suggests a generally horizontal band of residual points indicating that the error term assumptions are not satisfied. O The standardized residual plot has a different shape than the original residual plot. The plot suggests a generally horizontal band of residual points indicating that the error term assumptions are satisfied. O The standardized residual plot has a different shape than the original residual plot. The plot suggests a funnel pattern in the residuals indicating that the error term assumptions are not satisfied
Step by Step Solution
There are 3 Steps involved in it

Get step-by-step solutions from verified subject matter experts