

Question: please answer as soon as you can. 4. Presented below are the financial statements of Sisco Plastics Inc. Sisco Plastics Inc. Comparative Balance Sheets September
please answer as soon as you can.
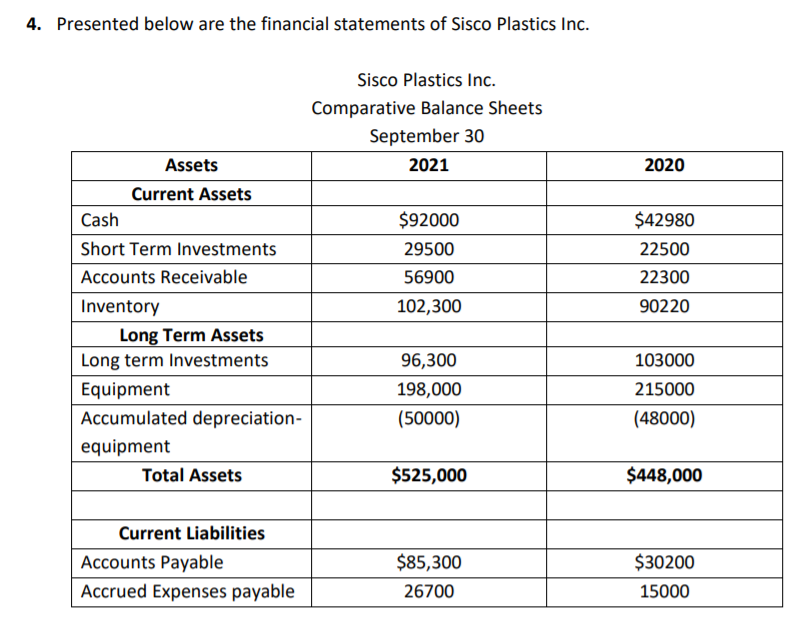
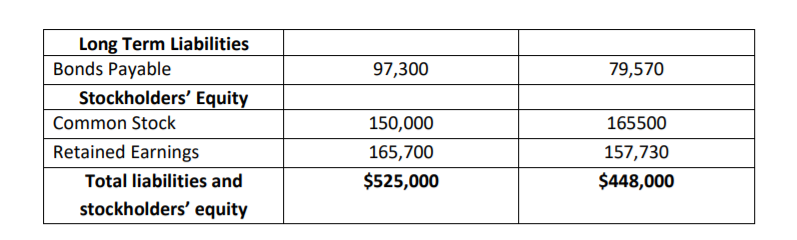
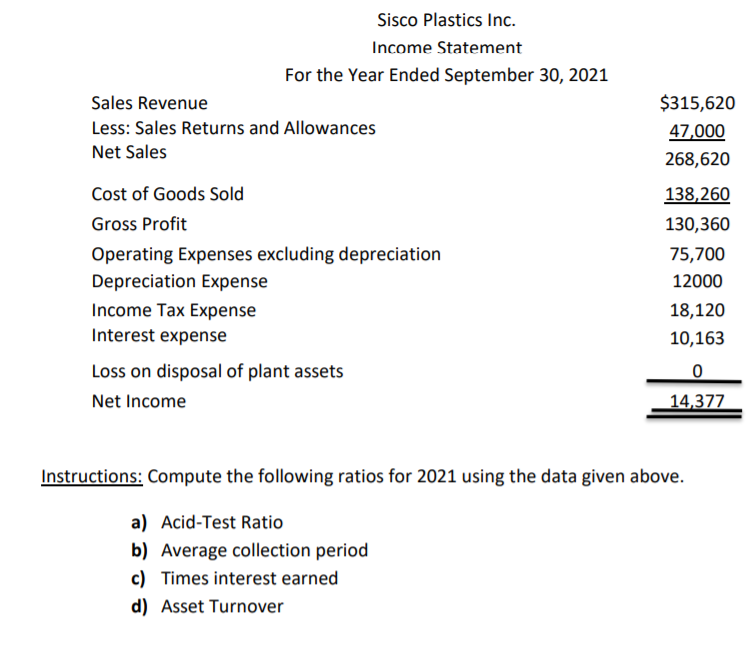
4. Presented below are the financial statements of Sisco Plastics Inc. Sisco Plastics Inc. Comparative Balance Sheets September 30 2021 2020 $92000 29500 $42980 22500 22300 90220 56900 102,300 Assets Current Assets Cash Short Term Investments Accounts Receivable Inventory Long Term Assets Long term Investments Equipment Accumulated depreciation- equipment Total Assets 96,300 198,000 (50000) 103000 215000 (48000) $525,000 $448,000 Current Liabilities Accounts Payable Accrued Expenses payable $85,300 26700 $30200 15000 97,300 79,570 Long Term Liabilities Bonds Payable Stockholders' Equity Common Stock Retained Earnings Total liabilities and stockholders' equity 150,000 165,700 $525,000 165500 157,730 $448,000 Sisco Plastics Inc. Income Statement For the Year Ended September 30, 2021 Sales Revenue Less: Sales Returns and Allowances Net Sales $315,620 47,000 268,620 Cost of Goods Sold Gross Profit Operating Expenses excluding depreciation Depreciation Expense Income Tax Expense Interest expense Loss on disposal of plant assets Net Income 138,260 130,360 75,700 12000 18,120 10,163 0 14,377 Instructions: Compute the following ratios for 2021 using the data given above. a) Acid-Test Ratio b) Average collection period c) Times interest earned d) Asset Turnover
Step by Step Solution
There are 3 Steps involved in it

Get step-by-step solutions from verified subject matter experts