

Question: PLEASE ANSWER ASAP 18. Use the three-stage dividend discount model to compute the value of Coca-Cola. (Use illustration 13.8 to help you) (20 points) In
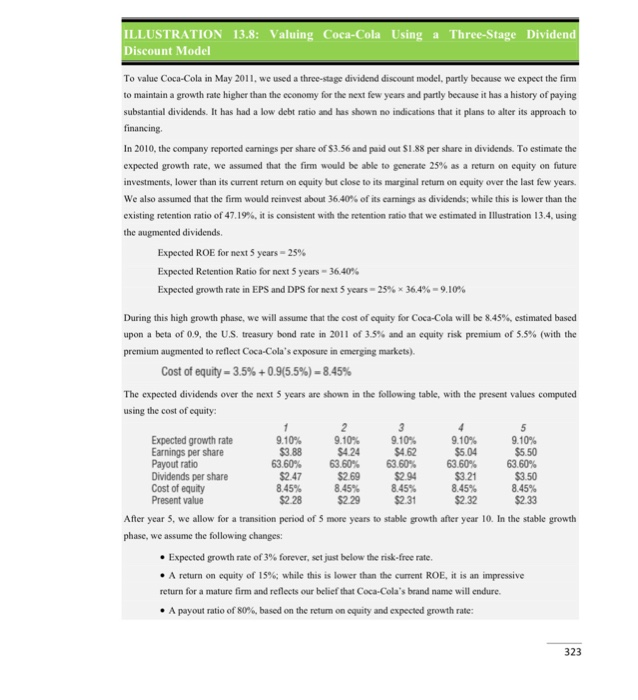
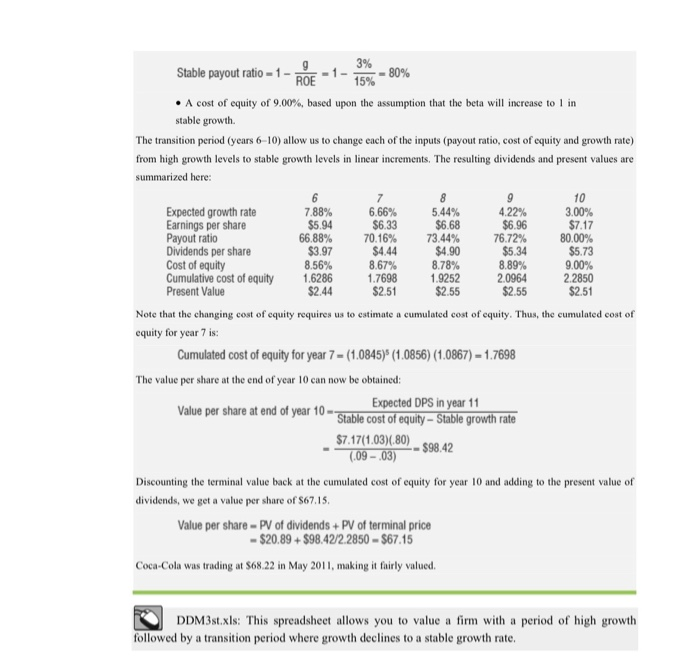
18. Use the three-stage dividend discount model to compute the value of Coca-Cola. (Use illustration 13.8 to help you) (20 points) In 2019, the company reported earnings per share of $3.56 and paid out $1.88 per share in dividends. To estimate the expected growth rate for the next 5 years, we assume that the firm would be able to generate 20% as a return on equity on future investments and that the firm would reinvest 40% of its earnings. 18a) Calculate the growth rate of earnings per share over the next 5 years. 18b) Calculate the payout ratio 180) Calculate the present value of dividends per share for the next 5 years. The cost of equity is 9% for the next 5 years. After year 5, we allow for a transition period of 5 more years to stable growth after year 10. In the stable growth phase, we assume the following changes: Expected growth rate of 4% forever A return of equity of 16% A cost of equity of 10% 18d) What is the stable payout ratio? 18e) Compute the present value of dividends per share for years 6 to 10. 18f) Compute the present value of terminal value. 18g) Compute the value per share for Coco-cola company. (c+e+f) ILLUSTRATION 13.8: Valuing Coca-Cola Using a Three-Stage Dividend Discount Model To value Coca-Cola in May 2011, we used a three-stage dividend discount model, partly because we expect the firm to maintain a growth rate higher than the economy for the next few years and partly because it has a history of paying substantial dividends. It has had a low debt ratio and has shown no indications that it plans to alter its approach to financing In 2010, the company reported earnings per share of $3.56 and paid out $1.88 per share in dividends. To estimate the expected growth rate, we assumed that the firm would be able to generate 25% as a return on equity on future investments, lower than its current return on equity but close to its marginal return on equity over the last few years, We also assumed that the firm would reinvest about 36.40% of its earnings as dividends, while this is lower than the existing retention ratio of 47.19%, it is consistent with the retention ratio that we estimated in Illustration 13.4, using the augmented dividends. Expected ROE for next 5 years -25% Expected Retention Ratio for next 5 years - 36.40% Expected growth rate in EPS and DPS for next 5 years -25% 36,4% -9.10% During this high growth phase, we will assume that the cost of cquity for Coca-Cola will be 8.45%, estimated based upon a beta of 0.9, the U.S. treasury bond rate in 2011 of 3.5% and an equity risk premium of 5.5% (with the premium augmented to reflect Coca-Cola's exposure in emerging markets). Cost of equity - 3.5%+0.9(5.5%) = 8.45% The expected dividends over the next 5 years are shown in the following table, with the present values computed using the cost of equity: 23 Expected growth rate 9.10% 9.10% 9.10% 9.10% 9.10% Earnings per share $3.88 $424 $4.62 $5.04 $5.50 Payout ratio 63.60% 63.60% 63.60% 63.60% 63.60% Dividends per share $2.47 $269 $2.94 $3.21 $3.50 Cost of equity 8.45% 8.45% 8.45% 8.45% 8.45% Present value $2.28 $229 $2.31 $2.32 $2.33 After year 5, we allow for a transition period of 5 more years to stable growth after year 10. In the stable growth phase, we assume the following changes: Expected growth rate of 3% forever, set just below the risk-free rate. A return on equity of 15%; while this is lower than the current ROE, it is an impressive return for a mature firm and reflects our belief that Coca-Cola's brand name will endure. A payout ratio of 80%, based on the return on equity and expected growth rate: Stable payout ratio - 1 - ROF - 1 - 1 - 80% 9. A cost of equity of 9.00%, based upon the assumption that the beta will increase to l in stable growth. The transition period (years 6-10) allow us to change each of the inputs (payout ratio, cost of equity and growth rate) from high growth levels to stable growth levels in linear increments. The resulting dividends and present values are summarized here: 10 Expected growth rate 7.88% 6.66% 5.44% 4.22% 3.00% Earnings per share $5.94 $6.33 $6.68 $6.96 $7.17 Payout ratio 66.88% 70.16% 73.44% 76.72% 80.00% Dividends per share $3.97 $4.44 $4.90 $5.34 $5.73 Cost of equity 8.56% 8.67% 8.78% 8.89% 9.00% Cumulative cost of equity 1.6286 1.7698 1.9252 2.0964 2.2850 Present Value $2.44 $2.51 $2.55 $2.55 $2.51 Note that the changing cost of equity requires us to estimate a cumulated cost of equity. Thus, the cumulated cost of equity for year 7 is: Cumulated cost of equity for year 7 - (1.0845) (1.0856) (1.0867) - 1.7698 The value per share at the end of year 10 can now be obtained: Value per share at end of year 10- Expected DPS in year 11 Stable cost of equity - Stable growth rate $7.17(1.03)(.80) -- $98.42 (09-03) Discounting the terminal value back at the cumulated cost of equity for year 10 and adding to the present value of dividends, we get a value per share of $67.15. Value per share - PV of dividends + PV of terminal price - $20.89 + $98.422.2850 - $67.15 Coca-Cola was trading at $68.22 in May 2011, making it fairly valued. K DDM3st.xls: This spreadsheet allows you to value a firm with a period of high growth followed by a transition period where growth declines to a stable growth rate
Step by Step Solution
There are 3 Steps involved in it

Get step-by-step solutions from verified subject matter experts