

Question: Please Answer Asap An R-bar chart is developed based on data collected from a process. The data is composed of 12 samples (k=12) of ten
Please Answer Asap 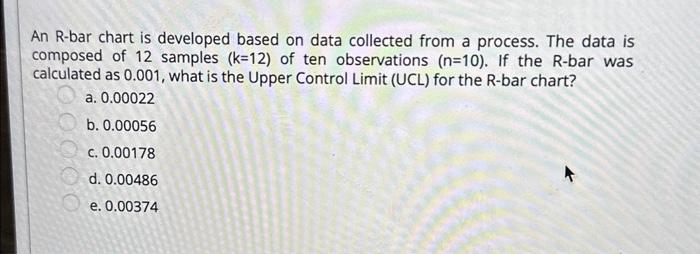
An R-bar chart is developed based on data collected from a process. The data is composed of 12 samples (k=12) of ten observations (n=10). If the R-bar was calculated as 0.001 , what is the Upper Control Limit (UCL) for the R-bar chart? a. 0.00022 b. 0.00056 C. 0.00178 d. 0.00486 e. 0.00374 An R-bar chart is developed based on data collected from a process. The data is composed of 12 samples (k=12) of ten observations (n=10). If the R-bar was calculated as 0.001 , what is the Upper Control Limit (UCL) for the R-bar chart? a. 0.00022 b. 0.00056 C. 0.00178 d. 0.00486 e. 0.00374
Step by Step Solution
There are 3 Steps involved in it
1 Expert Approved Answer
Step: 1 Unlock

Question Has Been Solved by an Expert!
Get step-by-step solutions from verified subject matter experts
Step: 2 Unlock
Step: 3 Unlock