

Question: please answer asap For problems 2 - 4 below, use the following set of test scores. (Relevant for the table and histogram: assume the minimum
please answer asap
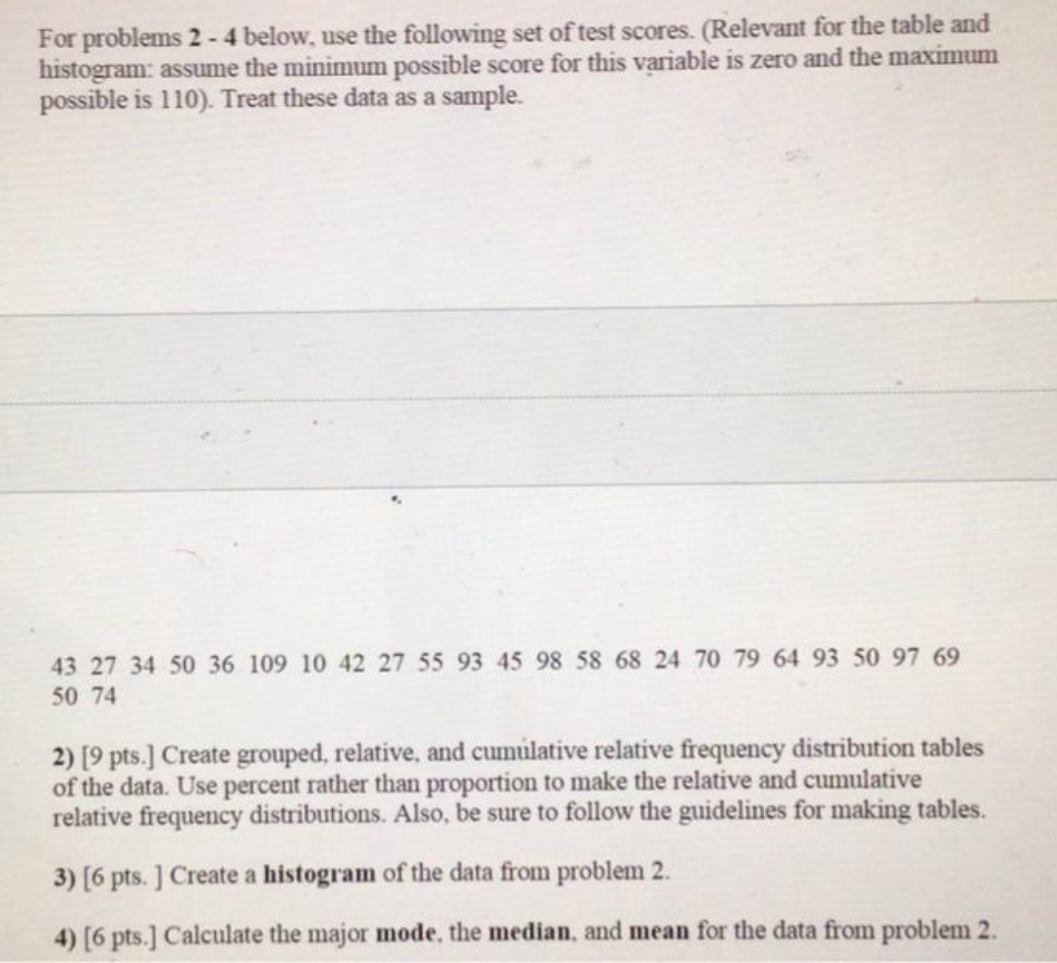
For problems 2 - 4 below, use the following set of test scores. (Relevant for the table and histogram: assume the minimum possible score for this variable is zero and the maximum possible is 1 10). Treat these data as a sample. 43 27 34 50 36 109 10 42 27 55 93 45 98 58 68 24 70 79 64 93 50 97 69 50 74 2) [9 pts.] Create grouped, relative, and cumulative relative frequency distribution tables of the data. Use percent rather than proportion to make the relative and cumulative relative frequency distributions. Also, be sure to follow the guidelines for making tables. 3) [6 pts. ] Create a histogram of the data from problem 2. 4) [6 pts.] Calculate the major mode, the median, and mean for the data from problem 2
Step by Step Solution
There are 3 Steps involved in it

Get step-by-step solutions from verified subject matter experts