

Question: - please answer asap Forecast Total book value equity for 2025. round to the second decimal place - Forecast total assets for 2023 (use quasi-SGR
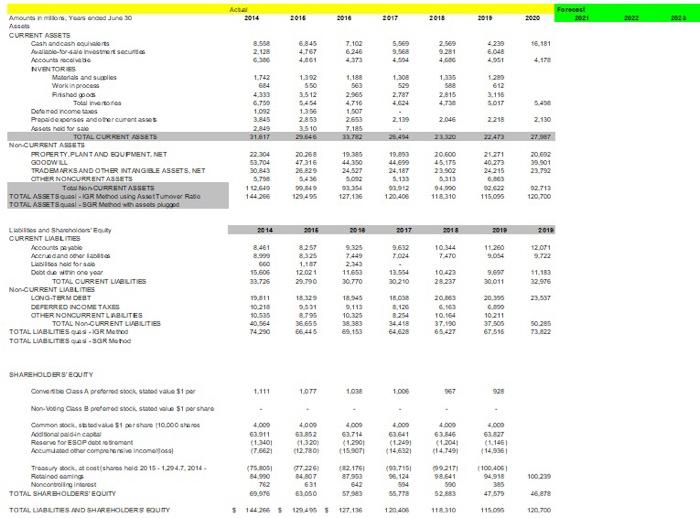
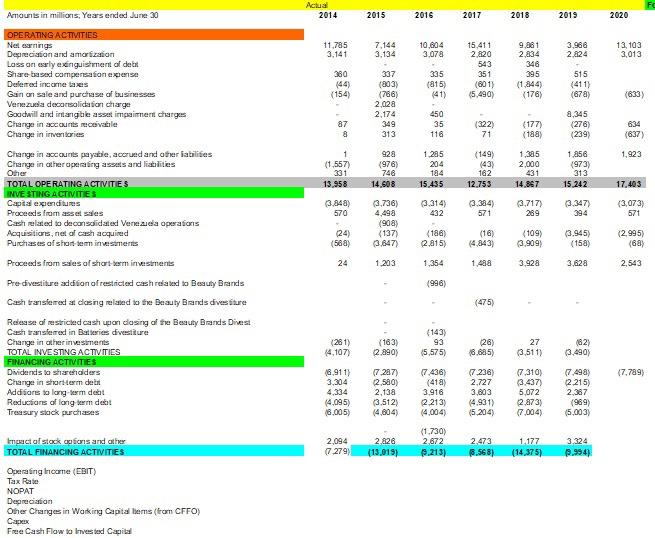
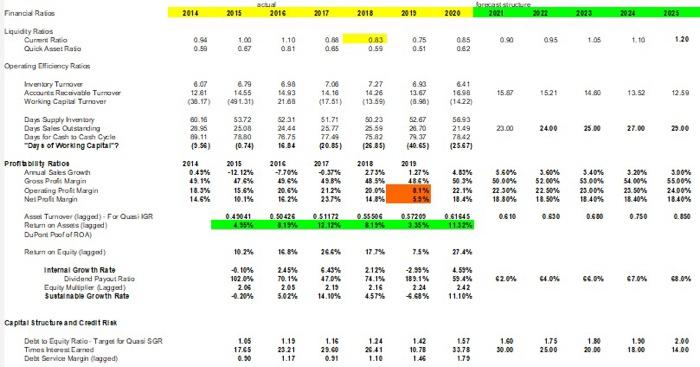
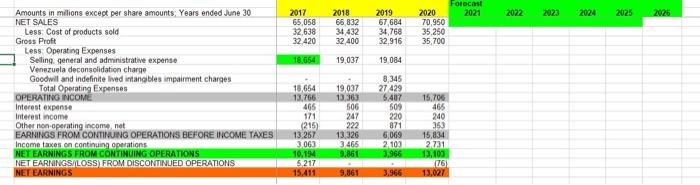
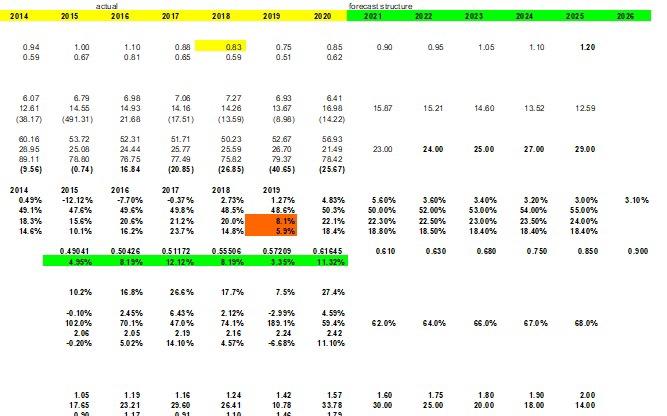
2014 2016 2016 2017 2018 2010 2000 Forest 2021 2022 2000 8.5 2.128 2009 6.845 4167 7.100 6.240 5.369 16.181 6.040 4. 1.188 563 612 1.300 500 2.787 4.00 1.392 550 3.512 5454 1.350 2.850 3.510 1.335 see 2.815 4.730 5017 Amousnestors, Year June 30 A CURRENT ASSETS Cash and cashours Awal-salvester Sect Mostunts racelete NVENTORES Materials and subs Work in process Finished cos Totale Der ricom Prop tercuront was Assets ned for sale TOTAL CURRENT SETS NonCURRENT ASSETS PROPERTY PLANT AND BOUFMENT.NET GOODWLL TRADEMARKS AND OTHER INTANGIBLE ASSETS, NET OTHER NONCURRENTASSETS To CURRENT ASSETS TOTAL ASSETSGR Mood using AssotTuve Radio TOTAL ASSETSoul-SGR Modesses plucard 3.450 1742 6:54 4.333 6.750 1.092 3.845 2.149 21.817 4.710 1.507 2.653 7.185 17 2.046 2218 2.130 2.129 2494 22.304 53.704 30.845 5.750 1640 20.268 47316 26.829 6436 09:40 129.495 19.385 44.350 24.527 s. 27307 20.692 99.901 23.790 44. 24.187 5.133 09.012 120.408 ZLAT 20271 40.273 24215 6.663 02.02 115.095 20.800 15.175 23.502 0313 04.000 118,310 127.130 02.712 120,700 2014 2016 2011 2017 2018 2012 2012 9.632 T.034 10.544 7470 11260 9.054 12.071 3.722 8.461 8909 GO 15.606 32.725 8.257 8.325 1.167 12.021 29.790 9.325 7.449 2,343 11653 30.770 13.554 30.210 1042) 28.237 9.69 30011 11.139 32.975 Lo and Share CURRENT LIABLITIES Accounts Acercando old for De wone you TOTAL CURRENT LVBLITIES NonCURRENT LIABLITIES LONG-TERM DEST DEPERRED INCOME TAXES OTHER NONCURRENT LAELITES TOTAL NO-CURRENT LIVEILITIES TOTAL LIABLITES GUSGR Metod TOTAL LIABLITES.SGR Moto 20.163 20:30 2357 19.11 10.210 90.525 40.64 74.250 18.329 9.551 8.795 36.655 66.446 18.45 9,113 10.325 38 383 89.159 18.00 3,120 8.254 34.46 64.628 TO 164 37.190 65.427 10211 37.505 67.516 50.285 1077 103 1.000 567 928 SHAREHOLDERS' EQUITY Converse Oass A drafordstock Stoke 51 por Non-wong Class refro stock state ale $1 per share Como toda 51 choose od solina Reserve for ESOP sont Accurated other compreincome Trock cost hold 2016.1.204.7.2014 Footained eaming Noncoming interest TOTAL SHAREHOLDERS' EQUITY 4.000 62.911 (1140 (7.6624 4.000 63.362 1.3.201 (12.7803 62.714 (1.2901 (15.50Ti 1.000 63.641 (1.2491 (14.6921 4.000 63.845 (1.2041 (14.7491 4.000 53.827 (1.1461 (14.99 (75.000 54.990 182.1761 87959 (09.7161 96.124 554 55.773 100239 0772261 84.807 631 63050 762 092171 98641 590 52.883 100 4061 94918 385 47.579 69.57 57.989 46.87 TOTAL LABUITIES AND SHAREHOLDERS BUTTY $14426 129.495 127.126 120 400 112310 115.00 120.700 Actual 2014 Amounts in millions. Years ended June 30 2015 2016 2017 2018 2019 2020 11,785 3.141 7,144 3.134 10,604 3.078 3.986 2.824 13,103 3,013 OPERATING ACTIVITIES Networnings Depreciation and amortizerian Lass an esrly extinguishment of dels Share-based compensation expense Deferred income taxes Gain on sale and purchase of businesses Venezuda deconsolidation charge Gouchwil and intangible asset impairment charges Change in accounts receivable Change in inventories 380 (44) (154) 335 (815) 41) 15.411 2.820 543 351 (801) (5.490) 9.881 2.834 346 395 (1.844) (176) 515 (411) (678) (633) 337 (803) (766) 2.028 2.174 349 313 87 8 450 35 116 (322) 71 (177) (183) 8,345 (276) (239) 634 (637) 1.285 1,923 1 (1.557) 331 13,958 928 (976) 746 14,608 204 184 15.435 (149) (43) 162 12.755 1,385 2,000 431 14.867 1.856 (973) 313 15.242 17.403 848) 570 3.314) 432 3,717) 289 3.347) 394 (3,073) 571 571 2.736) 4,498 (908) (137) 3,647) (24) (588) (186) 2,815) (16) (4.843) (109) (3.909) (3.945) (158) (2.995) (68) 24 1.203 1,354 1.438 3.928 3.628 2.543 Change in accounts payatle, accrued and other abilities Change in other operating assets and liabilities Other TOTAL OPERATING ACTIVITIES INVESTING ACTIVITIES Capital extends Proceeds from asset sales Cash related to deconsolidated Venda operations Acquisitions, net of cash acquired Purchases of short-term investments Proceeds from sales of short term investments Precivestiture adicionaf restricted cash related to Beauty Brands Cash taske med at cleing related to Beauty Brands diversitare Release of restricted cash upon closing of the Beauty Brands Divest Cash transferred in Batteries divestiture Change in other investments TOTAL INVESTING ACTIVITIES FINANCING ACTIVITIES Dividends to shareholders Change in short term derint Additions to long-term debt Reductions of long term debit Treasury stack purchases (996) (475) (281) 4,107) 26) (143) 93 (5,575) (163) 2 890) 18.685) 27 (3.511) (82) 3.490) (7.789) (8,911) 3,304 4,334 (4,095) (0.005) (7.287) 12.580) 2.138 (3.512) 4.604) (7 436) (418) 3.916 2.213) 4,004) (7236) 2.727 3.803 (4.931) (5.204) (7.310) 3.437) 5,072 2.873) (7,004) (7.498) 12.215) 2.387 (969) (5.003) knpact of stock colors and other TOTAL FINANCING ACTIVITIES 2,094 7279) 2,826 (13,019) (1.730) 2.672 9.213) 2.473 6.568) 1.177 (14.375 3.324 19,994) Operating income (EBIT) Tax Rate NOPAT Depreciation Oiher Changes in Working Capitaliems (trom CFFO) Cape Free Cash Flow to invested Capital 2014 2015 2016 2017 2018 2019 2020 2021 2023 2025 1.00 0.94 0.50 1.10 0.75 0.83 0.59 0.85 095 120 105 1.10 08 0.65 0.81 0.51 062 6.07 12 61 (38.17) 6.79 14:55 (491.31) 6.98 14.93 21.00 7.00 14.10 (17.51) 727 14.26 (13.39 8.93 12.67 16.90 15.87 1521 14.80 13.52 12.59 (1422 56.93 2149 5231 24.44 78.75 16.34 60.16 20.96 89.11 (9.56) 24.00 5372 25.08 76.80 (0.74) 23.00 23.00 52.67 20.70 2017 (40.65) 25.00 27.00 51.71 2577 77.00 20.65) 78.42 (25.67) Financial Raios Liquidity Radios Our Ratio Quick Asset Radio Operating Oficiency Rick Inventory Turnov Accounts Receivatie Turnever Working Capital Turnover Day Supply boventary Days Sales Outstanding Days for Cash Cash Cyle Day of Working Capitar? Profitability Ration Arual Sales Growth Gross Prakt Margin Operating Proft Margin Nei Poli Margin Asse Turnover (logged-For OIR Return on Aselagged DuPont Polo ROA) Reun on Equity wed) Internal Growth Rate Dividend Payout Rate Equity Miller Lagged Sustainable Growth Rate 2016 -1.70% 2017 -0.37% 2014 0.49% 49.1% 18.3% 14.6% 5023 23.59 75.82 (2885) 2018 2.73% 48 5% 20.0% 14.8% 45% 2015 -12.12% 17.6% 15.6% 10.1% 0.49041 4.95% 2019 1.27% 486% 0.1% 59% 4.63% 503% 22.1% 18.4% 21.2% 23.7% 5.60% 50.00% 22. 30% 18.30% 0610 3.60% 52.00% 22.50% 18.50% 20.6% 16.2% 3.40% 53.00% 23.00% 18.40% 0.600 3.20% 54.00% 23.50% 18.40% 0.750 3.00% 55.00% 24.00% 18.40% 0.50426 2.19% 051172 0.630 0.57209 3.35% 31 0.61545 11.32% 0.850 102% 168% 26.6% 1719 7.5% 27.4% 249% 70.1% 2.05 6.43% 47.0% 2.15 14.10% 2.12% 74.1% 2.16 4.57% -4.10% 102.0% 205 4,20% -2.9% 189.1% 2.24 4.68% 4.59% 59.4% 2.42 11.10% 20% 44.0% 66.9% 670% 68.0% 5.02% Capital Structure and Credit RISK Debt to Equity Ristio-Target bus SGR Times Interest and Del Service Marginaged) 1.05 1765 1.15 23 21 1.17 1.16 29.00 1.24 26.41 1.10 1.42 10.78 1.57 33.78 179 1.60 30.00 175 25.00 1.80 20.00 1.90 18.00 2.00 14.00 6.50 0.91 1.46 Forecast 2021 2022 2023 2024 2025 2017 65,058 32,638 32 420 2018 65 832 34 432 32 400 2019 67 684 34,768 32,916 2020 70,950 35.250 35,700 18,654 19,037 19,084 Amounts in milions except per share amounts: Years ended June 30 NET SALES Less Cost of products sold Gross Profit Less Operating Expenses Selling general and administrative expense Venezuela deconsolidation charge Goodwill and indefinite lived intangibles impairment charges Total Operating Expenses OPERATING INCOME Interest expense Interest income Other non operating income net EARNINGS FROM CONTINUING OPERATIONS BEFORE INCOME TAXES Income taxes on continuing operations NET EARNINGS FROM CONTINUING OPERATIONS NET EARNINGS LOSS FROM DISCONTINUED OPERATIONS NET EARNINGS 18,654 13.766 465 171 (215) 13.257 3063 10,194 5217 15,411 19,037 13.363 506 247 222 13.326 3465 9,861 8,345 27 429 5407 509 220 871 6,069 2.109 3,966 15,706 465 240 353 15,834 2721 13,103 76 13.027 9.861 3,966 forecast structure 2022 2014 acua 2016 2015 2017 2018 2019 2020 2021 2023 2024 2025 2026 0.90 0.95 1.05 1.10 120 0.94 0.59 1.00 0.67 1.10 0.81 0.80 0.65 0.83 0.59 0.75 0.51 0.85 0.62 6.07 12.81 (38.17) 6.79 14.55 (491.31) 6.98 14.93 21.68 7.08 14.16 (17.51) 727 1428 (13.59) 6.93 13.67 (8.98) 6.41 16.98 (1422) 15.87 15.21 14.80 13.52 12.59 23.00 24.00 25.00 27.00 29.00 80.16 28.95 29.11 (9.56) 53.72 25.08 78.80 (0.74) 52.31 24.44 78.75 16.84 51.71 25.77 77.49 (20.85) 50.23 25.59 75.82 (2685) 52.67 28.70 79.37 [40.55) 56.93 21.49 78.42 (25.67) 3.10% 2014 0.49% 49.1% 18.3% 14.6% 2015 - 12.12% 47.6% 15.6% 10.1% 2016 -7.70% 49.5% 20.5% 16.2% 2017 -0.37% 49.8% 212% 23.7% 2018 2.73% 48.5% 20.0% 14.8% 2019 1.27% 48.5% 8.15% 5.9% 4.83% 50.3% 22.1% 18.4% 5.60% 50.00% 22.30% 18.80 3.60% 52.00% 22.50% 18.50% 3.40% 53.00% 23.00% 18.40% 3.20% 54.00% 23.50% 18.40% 3.00% 55.00% 24.00% 40% 0.6 10 0.630 0.680 0.750 0.850 0.900 0.49041 4.95% 0.50426 3.19% 0.51172 12.12% 0.55505 3.19% 0.57209 3.35% 0.61645 11.32% 10.2% 16.8% 265% 17.7% 7.5% 27.4% 2.45% 70.1% 62.0% -2.99% 189.1% 2.24 65.0% -0.10% 102.0% 2.06 -0.20% 67.0% 68.0% 6.43% 47.0% 2.19 14.10% 64.0% 2.12% 74.1% 2.16 4.57% 2.05 4.59% 59.4% 242 11.10% 5.02% 4.68% 1.05 17.65 1.19 23.21 1.16 29.60 191 1.24 26.41 110 1.42 10.78 1.57 33.78 179 1.60 30.00 1.75 25.00 1.80 20.00 1.90 18.00 2.00 14.00 1 17 148 2014 2016 2016 2017 2018 2010 2000 Forest 2021 2022 2000 8.5 2.128 2009 6.845 4167 7.100 6.240 5.369 16.181 6.040 4. 1.188 563 612 1.300 500 2.787 4.00 1.392 550 3.512 5454 1.350 2.850 3.510 1.335 see 2.815 4.730 5017 Amousnestors, Year June 30 A CURRENT ASSETS Cash and cashours Awal-salvester Sect Mostunts racelete NVENTORES Materials and subs Work in process Finished cos Totale Der ricom Prop tercuront was Assets ned for sale TOTAL CURRENT SETS NonCURRENT ASSETS PROPERTY PLANT AND BOUFMENT.NET GOODWLL TRADEMARKS AND OTHER INTANGIBLE ASSETS, NET OTHER NONCURRENTASSETS To CURRENT ASSETS TOTAL ASSETSGR Mood using AssotTuve Radio TOTAL ASSETSoul-SGR Modesses plucard 3.450 1742 6:54 4.333 6.750 1.092 3.845 2.149 21.817 4.710 1.507 2.653 7.185 17 2.046 2218 2.130 2.129 2494 22.304 53.704 30.845 5.750 1640 20.268 47316 26.829 6436 09:40 129.495 19.385 44.350 24.527 s. 27307 20.692 99.901 23.790 44. 24.187 5.133 09.012 120.408 ZLAT 20271 40.273 24215 6.663 02.02 115.095 20.800 15.175 23.502 0313 04.000 118,310 127.130 02.712 120,700 2014 2016 2011 2017 2018 2012 2012 9.632 T.034 10.544 7470 11260 9.054 12.071 3.722 8.461 8909 GO 15.606 32.725 8.257 8.325 1.167 12.021 29.790 9.325 7.449 2,343 11653 30.770 13.554 30.210 1042) 28.237 9.69 30011 11.139 32.975 Lo and Share CURRENT LIABLITIES Accounts Acercando old for De wone you TOTAL CURRENT LVBLITIES NonCURRENT LIABLITIES LONG-TERM DEST DEPERRED INCOME TAXES OTHER NONCURRENT LAELITES TOTAL NO-CURRENT LIVEILITIES TOTAL LIABLITES GUSGR Metod TOTAL LIABLITES.SGR Moto 20.163 20:30 2357 19.11 10.210 90.525 40.64 74.250 18.329 9.551 8.795 36.655 66.446 18.45 9,113 10.325 38 383 89.159 18.00 3,120 8.254 34.46 64.628 TO 164 37.190 65.427 10211 37.505 67.516 50.285 1077 103 1.000 567 928 SHAREHOLDERS' EQUITY Converse Oass A drafordstock Stoke 51 por Non-wong Class refro stock state ale $1 per share Como toda 51 choose od solina Reserve for ESOP sont Accurated other compreincome Trock cost hold 2016.1.204.7.2014 Footained eaming Noncoming interest TOTAL SHAREHOLDERS' EQUITY 4.000 62.911 (1140 (7.6624 4.000 63.362 1.3.201 (12.7803 62.714 (1.2901 (15.50Ti 1.000 63.641 (1.2491 (14.6921 4.000 63.845 (1.2041 (14.7491 4.000 53.827 (1.1461 (14.99 (75.000 54.990 182.1761 87959 (09.7161 96.124 554 55.773 100239 0772261 84.807 631 63050 762 092171 98641 590 52.883 100 4061 94918 385 47.579 69.57 57.989 46.87 TOTAL LABUITIES AND SHAREHOLDERS BUTTY $14426 129.495 127.126 120 400 112310 115.00 120.700 Actual 2014 Amounts in millions. Years ended June 30 2015 2016 2017 2018 2019 2020 11,785 3.141 7,144 3.134 10,604 3.078 3.986 2.824 13,103 3,013 OPERATING ACTIVITIES Networnings Depreciation and amortizerian Lass an esrly extinguishment of dels Share-based compensation expense Deferred income taxes Gain on sale and purchase of businesses Venezuda deconsolidation charge Gouchwil and intangible asset impairment charges Change in accounts receivable Change in inventories 380 (44) (154) 335 (815) 41) 15.411 2.820 543 351 (801) (5.490) 9.881 2.834 346 395 (1.844) (176) 515 (411) (678) (633) 337 (803) (766) 2.028 2.174 349 313 87 8 450 35 116 (322) 71 (177) (183) 8,345 (276) (239) 634 (637) 1.285 1,923 1 (1.557) 331 13,958 928 (976) 746 14,608 204 184 15.435 (149) (43) 162 12.755 1,385 2,000 431 14.867 1.856 (973) 313 15.242 17.403 848) 570 3.314) 432 3,717) 289 3.347) 394 (3,073) 571 571 2.736) 4,498 (908) (137) 3,647) (24) (588) (186) 2,815) (16) (4.843) (109) (3.909) (3.945) (158) (2.995) (68) 24 1.203 1,354 1.438 3.928 3.628 2.543 Change in accounts payatle, accrued and other abilities Change in other operating assets and liabilities Other TOTAL OPERATING ACTIVITIES INVESTING ACTIVITIES Capital extends Proceeds from asset sales Cash related to deconsolidated Venda operations Acquisitions, net of cash acquired Purchases of short-term investments Proceeds from sales of short term investments Precivestiture adicionaf restricted cash related to Beauty Brands Cash taske med at cleing related to Beauty Brands diversitare Release of restricted cash upon closing of the Beauty Brands Divest Cash transferred in Batteries divestiture Change in other investments TOTAL INVESTING ACTIVITIES FINANCING ACTIVITIES Dividends to shareholders Change in short term derint Additions to long-term debt Reductions of long term debit Treasury stack purchases (996) (475) (281) 4,107) 26) (143) 93 (5,575) (163) 2 890) 18.685) 27 (3.511) (82) 3.490) (7.789) (8,911) 3,304 4,334 (4,095) (0.005) (7.287) 12.580) 2.138 (3.512) 4.604) (7 436) (418) 3.916 2.213) 4,004) (7236) 2.727 3.803 (4.931) (5.204) (7.310) 3.437) 5,072 2.873) (7,004) (7.498) 12.215) 2.387 (969) (5.003) knpact of stock colors and other TOTAL FINANCING ACTIVITIES 2,094 7279) 2,826 (13,019) (1.730) 2.672 9.213) 2.473 6.568) 1.177 (14.375 3.324 19,994) Operating income (EBIT) Tax Rate NOPAT Depreciation Oiher Changes in Working Capitaliems (trom CFFO) Cape Free Cash Flow to invested Capital 2014 2015 2016 2017 2018 2019 2020 2021 2023 2025 1.00 0.94 0.50 1.10 0.75 0.83 0.59 0.85 095 120 105 1.10 08 0.65 0.81 0.51 062 6.07 12 61 (38.17) 6.79 14:55 (491.31) 6.98 14.93 21.00 7.00 14.10 (17.51) 727 14.26 (13.39 8.93 12.67 16.90 15.87 1521 14.80 13.52 12.59 (1422 56.93 2149 5231 24.44 78.75 16.34 60.16 20.96 89.11 (9.56) 24.00 5372 25.08 76.80 (0.74) 23.00 23.00 52.67 20.70 2017 (40.65) 25.00 27.00 51.71 2577 77.00 20.65) 78.42 (25.67) Financial Raios Liquidity Radios Our Ratio Quick Asset Radio Operating Oficiency Rick Inventory Turnov Accounts Receivatie Turnever Working Capital Turnover Day Supply boventary Days Sales Outstanding Days for Cash Cash Cyle Day of Working Capitar? Profitability Ration Arual Sales Growth Gross Prakt Margin Operating Proft Margin Nei Poli Margin Asse Turnover (logged-For OIR Return on Aselagged DuPont Polo ROA) Reun on Equity wed) Internal Growth Rate Dividend Payout Rate Equity Miller Lagged Sustainable Growth Rate 2016 -1.70% 2017 -0.37% 2014 0.49% 49.1% 18.3% 14.6% 5023 23.59 75.82 (2885) 2018 2.73% 48 5% 20.0% 14.8% 45% 2015 -12.12% 17.6% 15.6% 10.1% 0.49041 4.95% 2019 1.27% 486% 0.1% 59% 4.63% 503% 22.1% 18.4% 21.2% 23.7% 5.60% 50.00% 22. 30% 18.30% 0610 3.60% 52.00% 22.50% 18.50% 20.6% 16.2% 3.40% 53.00% 23.00% 18.40% 0.600 3.20% 54.00% 23.50% 18.40% 0.750 3.00% 55.00% 24.00% 18.40% 0.50426 2.19% 051172 0.630 0.57209 3.35% 31 0.61545 11.32% 0.850 102% 168% 26.6% 1719 7.5% 27.4% 249% 70.1% 2.05 6.43% 47.0% 2.15 14.10% 2.12% 74.1% 2.16 4.57% -4.10% 102.0% 205 4,20% -2.9% 189.1% 2.24 4.68% 4.59% 59.4% 2.42 11.10% 20% 44.0% 66.9% 670% 68.0% 5.02% Capital Structure and Credit RISK Debt to Equity Ristio-Target bus SGR Times Interest and Del Service Marginaged) 1.05 1765 1.15 23 21 1.17 1.16 29.00 1.24 26.41 1.10 1.42 10.78 1.57 33.78 179 1.60 30.00 175 25.00 1.80 20.00 1.90 18.00 2.00 14.00 6.50 0.91 1.46 Forecast 2021 2022 2023 2024 2025 2017 65,058 32,638 32 420 2018 65 832 34 432 32 400 2019 67 684 34,768 32,916 2020 70,950 35.250 35,700 18,654 19,037 19,084 Amounts in milions except per share amounts: Years ended June 30 NET SALES Less Cost of products sold Gross Profit Less Operating Expenses Selling general and administrative expense Venezuela deconsolidation charge Goodwill and indefinite lived intangibles impairment charges Total Operating Expenses OPERATING INCOME Interest expense Interest income Other non operating income net EARNINGS FROM CONTINUING OPERATIONS BEFORE INCOME TAXES Income taxes on continuing operations NET EARNINGS FROM CONTINUING OPERATIONS NET EARNINGS LOSS FROM DISCONTINUED OPERATIONS NET EARNINGS 18,654 13.766 465 171 (215) 13.257 3063 10,194 5217 15,411 19,037 13.363 506 247 222 13.326 3465 9,861 8,345 27 429 5407 509 220 871 6,069 2.109 3,966 15,706 465 240 353 15,834 2721 13,103 76 13.027 9.861 3,966 forecast structure 2022 2014 acua 2016 2015 2017 2018 2019 2020 2021 2023 2024 2025 2026 0.90 0.95 1.05 1.10 120 0.94 0.59 1.00 0.67 1.10 0.81 0.80 0.65 0.83 0.59 0.75 0.51 0.85 0.62 6.07 12.81 (38.17) 6.79 14.55 (491.31) 6.98 14.93 21.68 7.08 14.16 (17.51) 727 1428 (13.59) 6.93 13.67 (8.98) 6.41 16.98 (1422) 15.87 15.21 14.80 13.52 12.59 23.00 24.00 25.00 27.00 29.00 80.16 28.95 29.11 (9.56) 53.72 25.08 78.80 (0.74) 52.31 24.44 78.75 16.84 51.71 25.77 77.49 (20.85) 50.23 25.59 75.82 (2685) 52.67 28.70 79.37 [40.55) 56.93 21.49 78.42 (25.67) 3.10% 2014 0.49% 49.1% 18.3% 14.6% 2015 - 12.12% 47.6% 15.6% 10.1% 2016 -7.70% 49.5% 20.5% 16.2% 2017 -0.37% 49.8% 212% 23.7% 2018 2.73% 48.5% 20.0% 14.8% 2019 1.27% 48.5% 8.15% 5.9% 4.83% 50.3% 22.1% 18.4% 5.60% 50.00% 22.30% 18.80 3.60% 52.00% 22.50% 18.50% 3.40% 53.00% 23.00% 18.40% 3.20% 54.00% 23.50% 18.40% 3.00% 55.00% 24.00% 40% 0.6 10 0.630 0.680 0.750 0.850 0.900 0.49041 4.95% 0.50426 3.19% 0.51172 12.12% 0.55505 3.19% 0.57209 3.35% 0.61645 11.32% 10.2% 16.8% 265% 17.7% 7.5% 27.4% 2.45% 70.1% 62.0% -2.99% 189.1% 2.24 65.0% -0.10% 102.0% 2.06 -0.20% 67.0% 68.0% 6.43% 47.0% 2.19 14.10% 64.0% 2.12% 74.1% 2.16 4.57% 2.05 4.59% 59.4% 242 11.10% 5.02% 4.68% 1.05 17.65 1.19 23.21 1.16 29.60 191 1.24 26.41 110 1.42 10.78 1.57 33.78 179 1.60 30.00 1.75 25.00 1.80 20.00 1.90 18.00 2.00 14.00 1 17 148
Step by Step Solution
There are 3 Steps involved in it

Get step-by-step solutions from verified subject matter experts