

Question: Please answer asap QUESTION 1. Question 1: Mian and Su (2010) suggest that areas with high credit growth suffered the most during the nancial crisis
Please answer asap

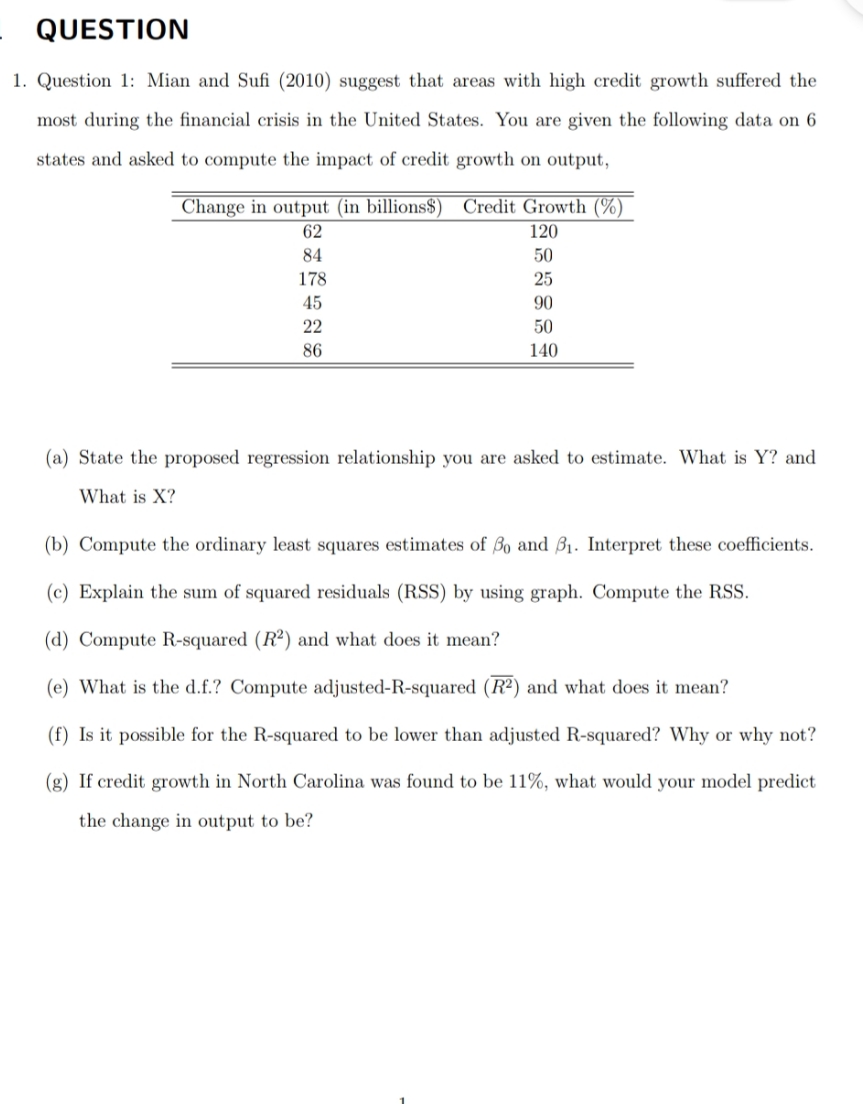
QUESTION 1. Question 1: Mian and Su (2010) suggest that areas with high credit growth suffered the most during the nancial crisis in the United States. You are given the following data on 6 states and asked to compute the impact of credit growth on output, Change in output (in billions$} Credit Growth {5a) 62 120 84 5!] 173 25 45 9!] 22 5D 36 140 (a) State the proposed regression relationship you are asked to estimate. What is Y? and What is X? (b) Compute the ordinary least squares Intimates of u and 131- Interpret thule coefcients. (c) Explain the sum of squared residuals (RSS) by using graph. Compute the RES. {(1) Compute Rsquared (R2) and what does it mean? (e) What is the d.f.? Compute adjusted-Rsquared (W) and what does it mean? (f) Is it possible for the R-squared to be lower than adjusted R-squared? Why or why not? (g) If credit growth in North Carolina was found to be 11%, what would your model predict the change in output to be
Step by Step Solution
There are 3 Steps involved in it

Get step-by-step solutions from verified subject matter experts