

Question: please answer asap the excel is just for reference you dont need the actual excel sheet Comments Please complete this week Use the model in
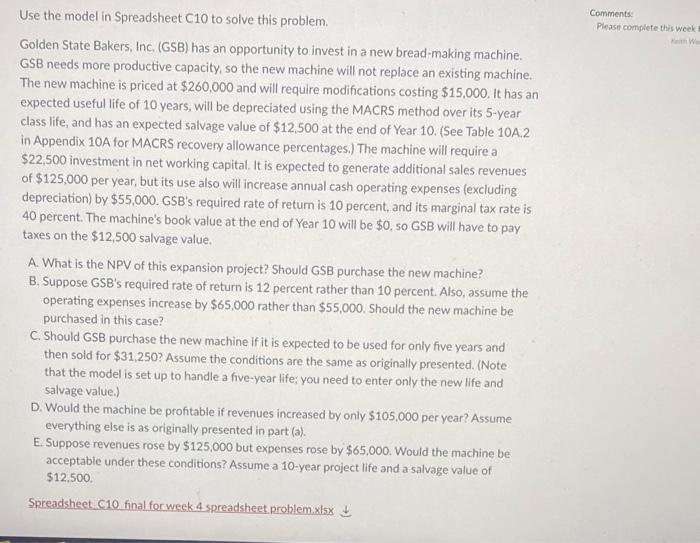
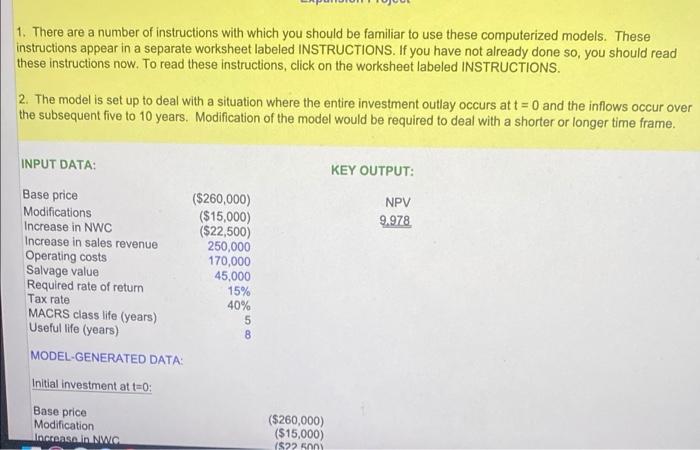
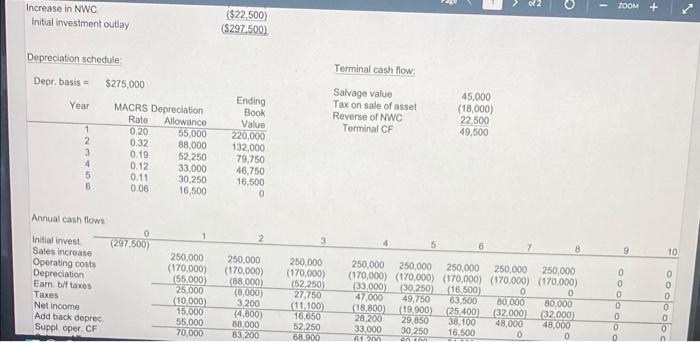
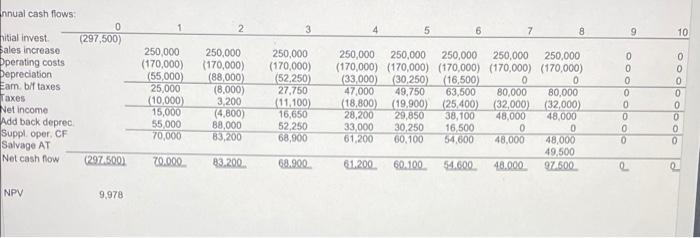
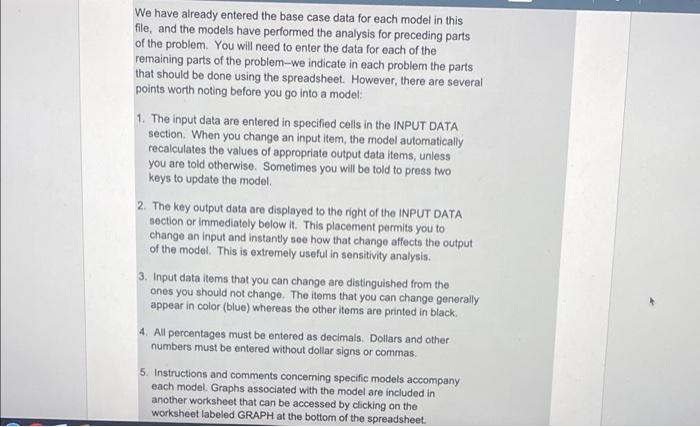
Comments Please complete this week Use the model in Spreadsheet C10 to solve this problem Golden State Bakers, Inc. (GSB) has an opportunity to invest in a new bread-making machine. GSB needs more productive capacity, so the new machine will not replace an existing machine. The new machine is priced at $260,000 and will require modifications costing $15,000. It has an expected useful life of 10 years, will be depreciated using the MACRS method over its 5-year class life, and has an expected salvage value of $12,500 at the end of Year 10. (See Table 10A.2 in Appendix 10A for MACRS recovery allowance percentages.) The machine will require a $22,500 investment in net working capital. It is expected to generate additional sales revenues of $125,000 per year, but its use also will increase annual cash operating expenses (excluding depreciation) by $55,000. GSB's required rate of return is 10 percent, and its marginal tax rate is 40 percent. The machine's book value at the end of Year 10 will be $0, so GSB will have to pay taxes on the $12,500 salvage value. A. What is the NPV of this expansion project? Should GSB purchase the new machine? B. Suppose GSB's required rate of return is 12 percent rather than 10 percent. Also, assume the operating expenses increase by $65,000 rather than $55,000. Should the new machine be purchased in this case? C. Should GSB purchase the new machine if it is expected to be used for only five years and then sold for $31.250? Assume the conditions are the same as originally presented. (Note that the model is set up to handle a five-year life; you need to enter only the new life and salvage value. D. Would the machine be profitable if revenues increased by only $105,000 per year? Assume everything else is as originally presented in part (a). E. Suppose revenues rose by $125,000 but expenses rose by $65,000. Would the machine be acceptable under these conditions? Assume a 10-year project life and a salvage value of $12,500 Spreadsheet 10 final for week 4 spreadsheet problem.xlsx 1. There are a number of instructions with which you should be familiar to use these computerized models. These instructions appear in a separate worksheet labeled INSTRUCTIONS. If you have not already done so, you should read these instructions now. To read these instructions, click on the worksheet labeled INSTRUCTIONS 2. The model is set up to deal with a situation where the entire investment outlay occurs at t = 0 and the inflows occur over the subsequent five to 10 years. Modification of the model would be required to deal with a shorter or longer time frame. INPUT DATA: KEY OUTPUT: NPV 9.978 Base price Modifications Increase in NWC Increase in sales revenue Operating costs Salvage value Required rate of return Tax rate MACRS class life (years) Useful life (years) MODEL-GENERATED DATA: Initial investment at t=0 ($260,000) ($15,000) ($22,500) 250,000 170,000 45,000 15% 40% 5 8 Base price Modification Increase in NWC ($260,000) ($15,000) 1$22 500 2 - ZOOM + + Increase in NWC Initial investment outlay ($22,500) (5297.500) Depreciation schedule Terminal cash flow Depr. basis $275,000 Year Salvage value Tax on sale of asset Reverse of NWC Terminal CF 45,000 (18,000) 22,500 49,600 1 2 3 4 5 6 MACRS Depreciation Rate Allowance 0.20 55,000 0.32 88,000 0.19 52,250 0.12 33,000 0.11 30.250 0.06 16,500 Ending Book Value 220,000 132,000 79,750 46,750 16,500 0 2 3 8 9 10 Annual cash flows 0 Initial invest (297,500) Sales increase Operating costs Depreciation Eam bf taxes Taxes Net income Add back deprec Supploper CF 250,000 (170,000) (55,000) 25,000 10,000) 15.000 55,000 70,000 250.000 (170,000) (88.000 (8,000) 3,200 (4.800) 88,000 83.200 250,000 (170,000) 152250 27.750 (11.100) 16.650 52,250 68.900 250,000 250,000 250,000 250,000 250,000 (170,000) (170,000) (170,000) (170,000) (170,000) (33.000) 30.250) (16,500) 0 0 47.000 49.750 63.500 80.000 80.000 (18.800 (19.900) (25 400 (32.000) (32.000) 28,200 29.850 38,100 48.000 48.000 33,000 30 250 16.500 0 D en 0 0 0 0 0 soooooo 0 3 4 5 6 7 8 9 9 10 nnual cash flows: 0 nitial invest (297,500) Sales increase Operating costs Depreciation Eam bif taxes Taxes Net Income Add back deprec Suppl . oper. CF Salvage AT Net cash flow (2974500) 250,000 (170,000) (55,000) 25,000 (10,000 15,000 55,000 70,000 250.000 (170,000) (88,000 (8,000) 3,200 (4.800) 88,000 83.200 250,000 (170,000) (52.250) 27.750 (11,100) 16,650 52,250 68,900 250,000 250,000 250,000 250,000 250,000 (170,000) (170,000) (170,000) (170,000) (170,000) (33,000 (30,250) (16,500) 0 0 47.000 49.750 63,500 80,000 80,000 (18,800) (19,900) (25,400) (32,000) (32,000) 28,200 29,850 38,100 48.000 48,000 33,000 30,250 16,500 0 0 61,200 60.100 54.600 48,000 48,000 49.500 61.200 60.100 54.600 48.000 97.500 oooooooo 70.000 83.200 68.900 2 NPV 9,978 We have already entered the base case data for each model in this file, and the models have performed the analysis for preceding parts of the problem. You will need to enter the data for each of the remaining parts of the problem-we indicate in each problem the parts that should be done using the spreadsheet. However, there are several points worth noting before you go into a model: 1. The input data are entered in specified cells in the INPUT DATA section. When you change an input item, the model automatically recalculates the values of appropriate output data items, unless you are told otherwise. Sometimes you will be told to press two keys to update the model. 2. The key output data are displayed to the right of the INPUT DATA section or immediately below it. This placement permits you to change an input and instantly see how that change affects the output of the model. This is extremely useful in sensitivity analysis. 3. Input data items that you can change are distinguished from the ones you should not change. The items that you can change generally appear in color (blue) whereas the other items are printed in black 4. All percentages must be entered as decimals. Dollars and other numbers must be entered without dollar signs or commas. 5. Instructions and comments concerning specific models accompany each model. Graphs associated with the model are included in another worksheet that can be accessed by clicking on the worksheet labeled GRAPH at the bottom of the spreadsheet. Comments Please complete this week Use the model in Spreadsheet C10 to solve this problem Golden State Bakers, Inc. (GSB) has an opportunity to invest in a new bread-making machine. GSB needs more productive capacity, so the new machine will not replace an existing machine. The new machine is priced at $260,000 and will require modifications costing $15,000. It has an expected useful life of 10 years, will be depreciated using the MACRS method over its 5-year class life, and has an expected salvage value of $12,500 at the end of Year 10. (See Table 10A.2 in Appendix 10A for MACRS recovery allowance percentages.) The machine will require a $22,500 investment in net working capital. It is expected to generate additional sales revenues of $125,000 per year, but its use also will increase annual cash operating expenses (excluding depreciation) by $55,000. GSB's required rate of return is 10 percent, and its marginal tax rate is 40 percent. The machine's book value at the end of Year 10 will be $0, so GSB will have to pay taxes on the $12,500 salvage value. A. What is the NPV of this expansion project? Should GSB purchase the new machine? B. Suppose GSB's required rate of return is 12 percent rather than 10 percent. Also, assume the operating expenses increase by $65,000 rather than $55,000. Should the new machine be purchased in this case? C. Should GSB purchase the new machine if it is expected to be used for only five years and then sold for $31.250? Assume the conditions are the same as originally presented. (Note that the model is set up to handle a five-year life; you need to enter only the new life and salvage value. D. Would the machine be profitable if revenues increased by only $105,000 per year? Assume everything else is as originally presented in part (a). E. Suppose revenues rose by $125,000 but expenses rose by $65,000. Would the machine be acceptable under these conditions? Assume a 10-year project life and a salvage value of $12,500 Spreadsheet 10 final for week 4 spreadsheet problem.xlsx 1. There are a number of instructions with which you should be familiar to use these computerized models. These instructions appear in a separate worksheet labeled INSTRUCTIONS. If you have not already done so, you should read these instructions now. To read these instructions, click on the worksheet labeled INSTRUCTIONS 2. The model is set up to deal with a situation where the entire investment outlay occurs at t = 0 and the inflows occur over the subsequent five to 10 years. Modification of the model would be required to deal with a shorter or longer time frame. INPUT DATA: KEY OUTPUT: NPV 9.978 Base price Modifications Increase in NWC Increase in sales revenue Operating costs Salvage value Required rate of return Tax rate MACRS class life (years) Useful life (years) MODEL-GENERATED DATA: Initial investment at t=0 ($260,000) ($15,000) ($22,500) 250,000 170,000 45,000 15% 40% 5 8 Base price Modification Increase in NWC ($260,000) ($15,000) 1$22 500 2 - ZOOM + + Increase in NWC Initial investment outlay ($22,500) (5297.500) Depreciation schedule Terminal cash flow Depr. basis $275,000 Year Salvage value Tax on sale of asset Reverse of NWC Terminal CF 45,000 (18,000) 22,500 49,600 1 2 3 4 5 6 MACRS Depreciation Rate Allowance 0.20 55,000 0.32 88,000 0.19 52,250 0.12 33,000 0.11 30.250 0.06 16,500 Ending Book Value 220,000 132,000 79,750 46,750 16,500 0 2 3 8 9 10 Annual cash flows 0 Initial invest (297,500) Sales increase Operating costs Depreciation Eam bf taxes Taxes Net income Add back deprec Supploper CF 250,000 (170,000) (55,000) 25,000 10,000) 15.000 55,000 70,000 250.000 (170,000) (88.000 (8,000) 3,200 (4.800) 88,000 83.200 250,000 (170,000) 152250 27.750 (11.100) 16.650 52,250 68.900 250,000 250,000 250,000 250,000 250,000 (170,000) (170,000) (170,000) (170,000) (170,000) (33.000) 30.250) (16,500) 0 0 47.000 49.750 63.500 80.000 80.000 (18.800 (19.900) (25 400 (32.000) (32.000) 28,200 29.850 38,100 48.000 48.000 33,000 30 250 16.500 0 D en 0 0 0 0 0 soooooo 0 3 4 5 6 7 8 9 9 10 nnual cash flows: 0 nitial invest (297,500) Sales increase Operating costs Depreciation Eam bif taxes Taxes Net Income Add back deprec Suppl . oper. CF Salvage AT Net cash flow (2974500) 250,000 (170,000) (55,000) 25,000 (10,000 15,000 55,000 70,000 250.000 (170,000) (88,000 (8,000) 3,200 (4.800) 88,000 83.200 250,000 (170,000) (52.250) 27.750 (11,100) 16,650 52,250 68,900 250,000 250,000 250,000 250,000 250,000 (170,000) (170,000) (170,000) (170,000) (170,000) (33,000 (30,250) (16,500) 0 0 47.000 49.750 63,500 80,000 80,000 (18,800) (19,900) (25,400) (32,000) (32,000) 28,200 29,850 38,100 48.000 48,000 33,000 30,250 16,500 0 0 61,200 60.100 54.600 48,000 48,000 49.500 61.200 60.100 54.600 48.000 97.500 oooooooo 70.000 83.200 68.900 2 NPV 9,978 We have already entered the base case data for each model in this file, and the models have performed the analysis for preceding parts of the problem. You will need to enter the data for each of the remaining parts of the problem-we indicate in each problem the parts that should be done using the spreadsheet. However, there are several points worth noting before you go into a model: 1. The input data are entered in specified cells in the INPUT DATA section. When you change an input item, the model automatically recalculates the values of appropriate output data items, unless you are told otherwise. Sometimes you will be told to press two keys to update the model. 2. The key output data are displayed to the right of the INPUT DATA section or immediately below it. This placement permits you to change an input and instantly see how that change affects the output of the model. This is extremely useful in sensitivity analysis. 3. Input data items that you can change are distinguished from the ones you should not change. The items that you can change generally appear in color (blue) whereas the other items are printed in black 4. All percentages must be entered as decimals. Dollars and other numbers must be entered without dollar signs or commas. 5. Instructions and comments concerning specific models accompany each model. Graphs associated with the model are included in another worksheet that can be accessed by clicking on the worksheet labeled GRAPH at the bottom of the spreadsheet
Step by Step Solution
There are 3 Steps involved in it

Get step-by-step solutions from verified subject matter experts