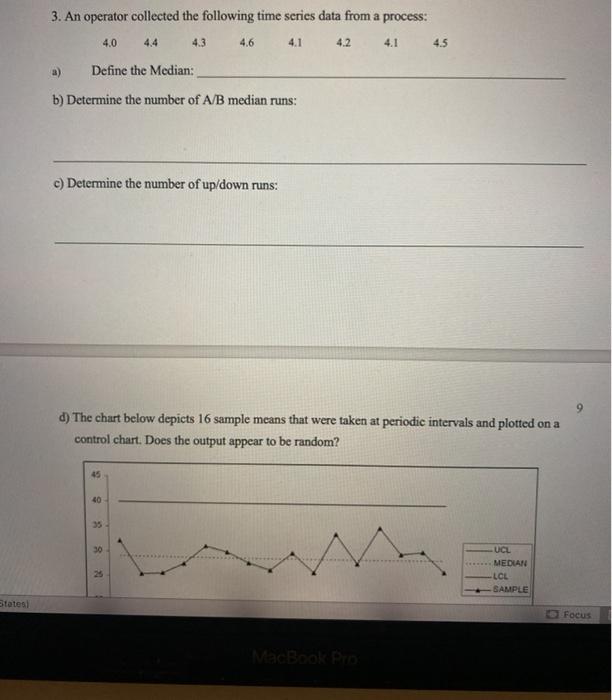
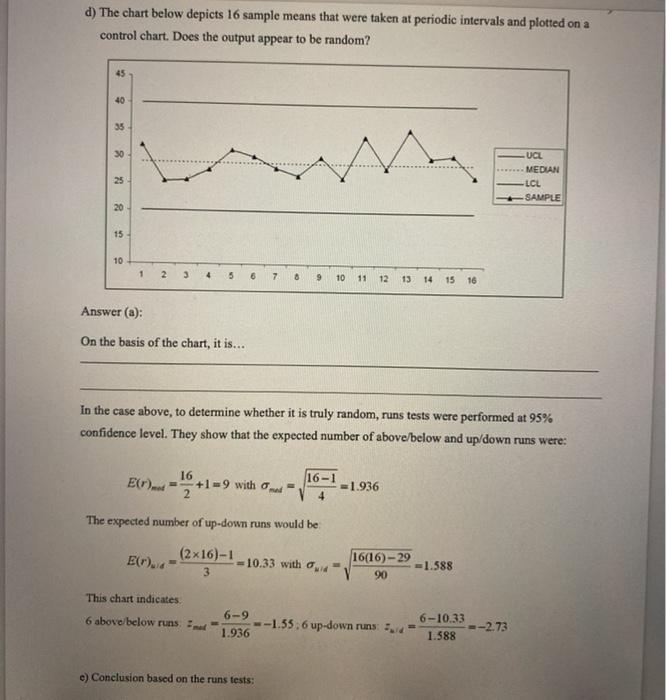
Question: please answer asap! will give thumbs up 3. An operator collected the following time series data from a process: 4.0 4.3 4.6 4.1 4.2 4.1

please answer asap! will give thumbs up
please answer asap! will give thumbs up 3. An
3. An operator collected the following time series data from a process: 4.0 4.3 4.6 4.1 4.2 4.1 4.5 Define the Median: 4.4 b) Determine the number of A/B median runs: c) Determine the number of up/down runs: 9 d) The chart below depicts 16 sample means that were taken at periodic intervals and plotted on a control chart. Does the output appear to be random? 45 40 30 UCL MEDIAN LCL SAMPLE States! Focus MacBook Pro d) The chart below depicts 16 sample means that were taken at periodic intervals and plotted on a control chart. Does the output appear to be random? 45 40 35 30 25 UCL MEDIAN LCL SAMPLE 20 15 10 1 2 3 4 5 6 8 9 10 11 12 13 14 15 16 Answer (a): On the basis of the chart, it is... In the case above, to determine whether it is truly random, runs tests were performed at 95% confidence level. They show that the expected number of above/below and up/down runs were: 16-1 E(). 16 +1 = 9 with and 2 1.936 The expected number of up-down runs would be E(r)... (2x16)-1 -10.33 with . 3 16(16)-29 -1.588 90 This chart indicates 6 above below runs 6-9 1.936 -1.55.6 up-down runs 6-10.33 --2.73 1.588 e) Conclusion based on the runs tests

Step by Step Solution

There are 3 Steps involved in it

1 Expert Approved Answer
Step: 1 Unlock blur-text-image
Question Has Been Solved by an Expert!

Get step-by-step solutions from verified subject matter experts

Step: 2 Unlock
Step: 3 Unlock

Students Have Also Explored These Related General Management Questions!