

Question: please answer B, C, & D The following data show the number of laptop computers sold each month at a retail store: Month January February
please answer B, C, & D
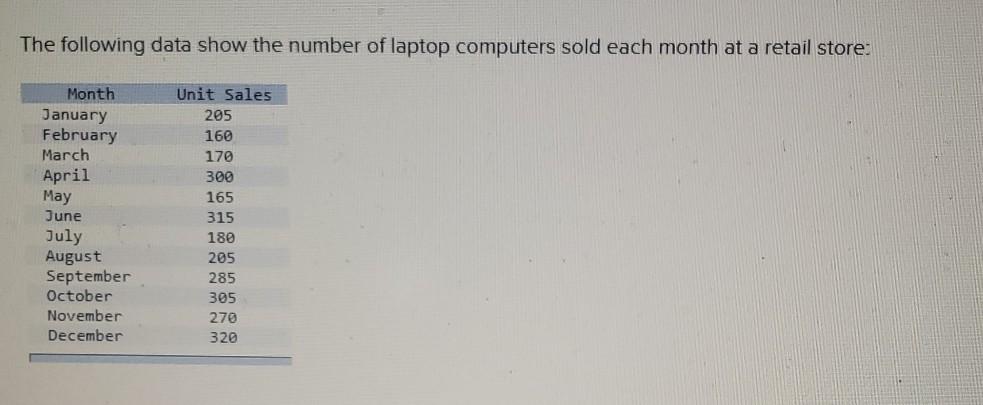
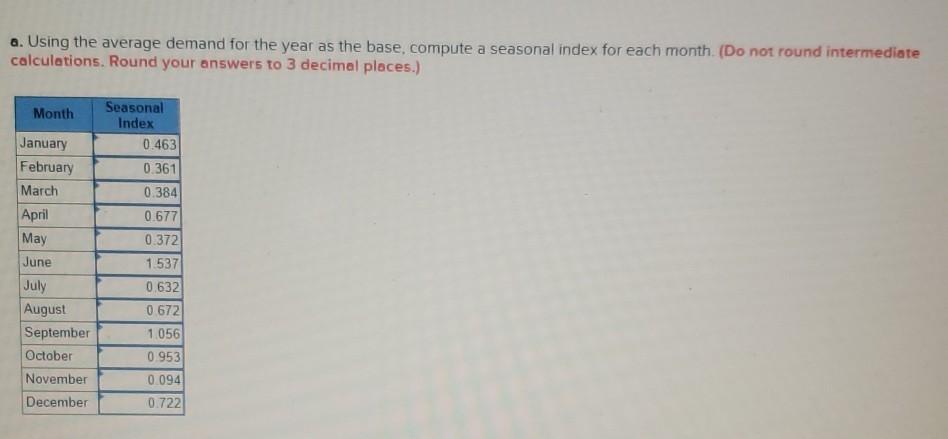
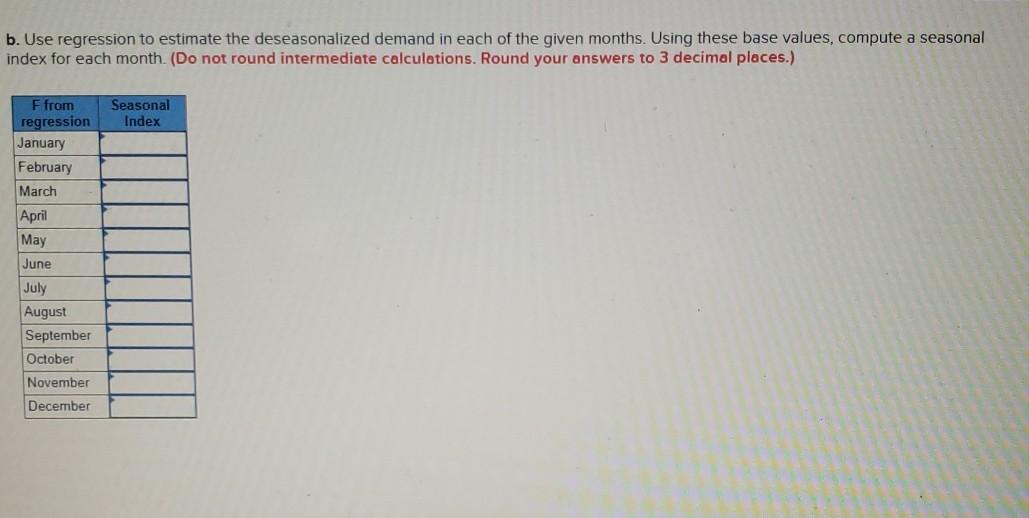
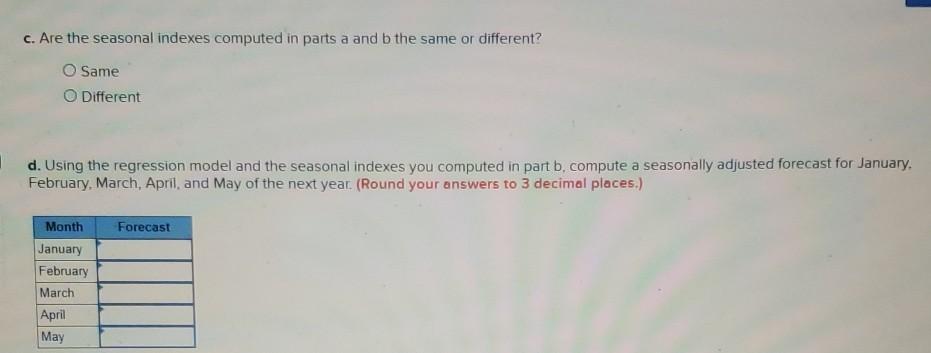
The following data show the number of laptop computers sold each month at a retail store: Month January February March April May June July August September October November December Unit Sales 205 160 170 300 165 315 180 205 285 305 270 320 a. Using the average demand for the year as the base, compute a seasonal index for each month (Do not round intermediate calculations. Round your answers to 3 decimal places.) Month January February March April May June July August September October November December Seasonal Index 0.463 0.361 0.384 0.677 0.372 1.537 0.632 0672 1.056 0.953 0.094 0.722 b. Use regression to estimate the deseasonalized demand in each of the given months. Using these base values, compute a seasonal index for each month. (Do not round intermediate calculations. Round your answers to 3 decimal places.) Seasonal Index F from regression January February March April May June July August September October November December c. Are the seasonal indexes computed in parts a and b the same or different? O Same O Different d. Using the regression model and the seasonal indexes you computed in part b, compute a seasonally adjusted forecast for January February March April, and May of the next year. (Round your answers to 3 decimal places.) Month Forecast January February March April MayStep by Step Solution
There are 3 Steps involved in it
1 Expert Approved Answer
Step: 1 Unlock

Question Has Been Solved by an Expert!
Get step-by-step solutions from verified subject matter experts
Step: 2 Unlock
Step: 3 Unlock