

Question: Please Answer B The accompanying data table contains the listed prices (in thousands of dollars) and the number of square feet for 20 homes listed
Please Answer B
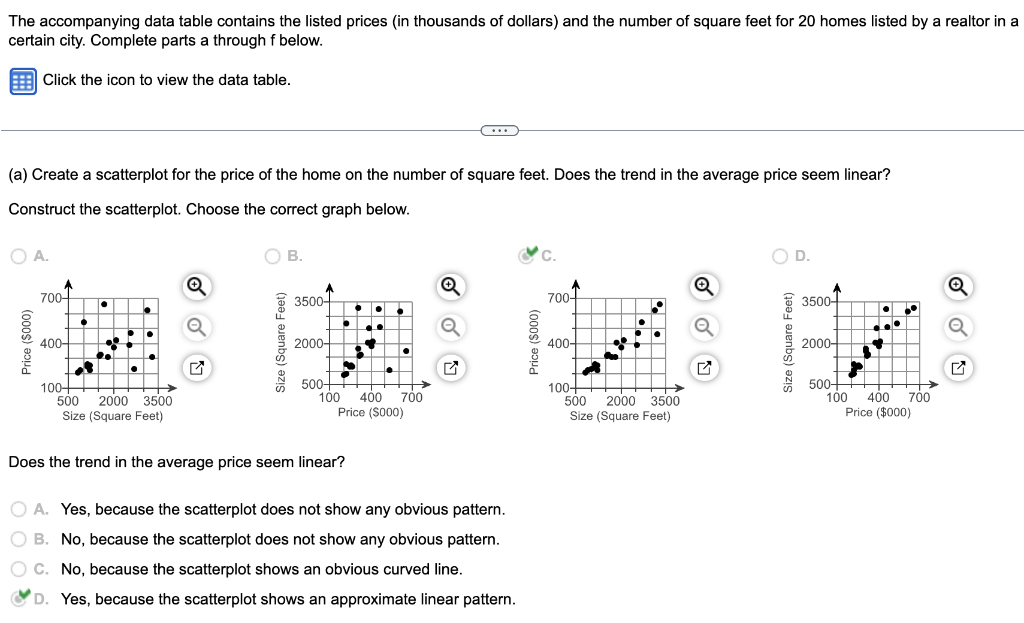
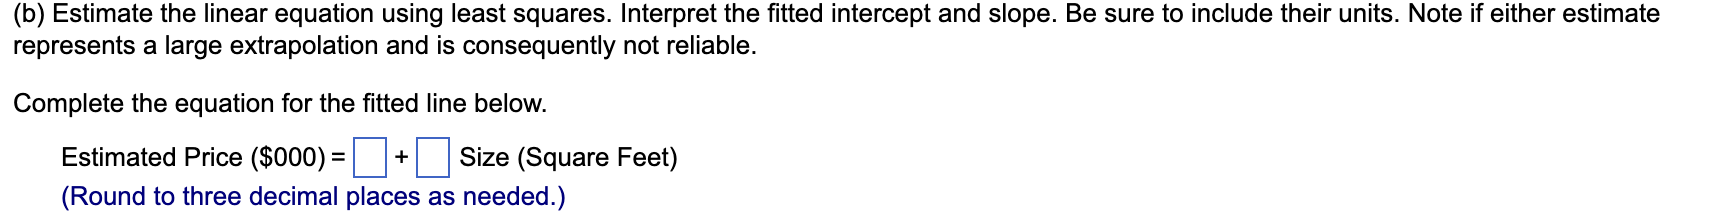
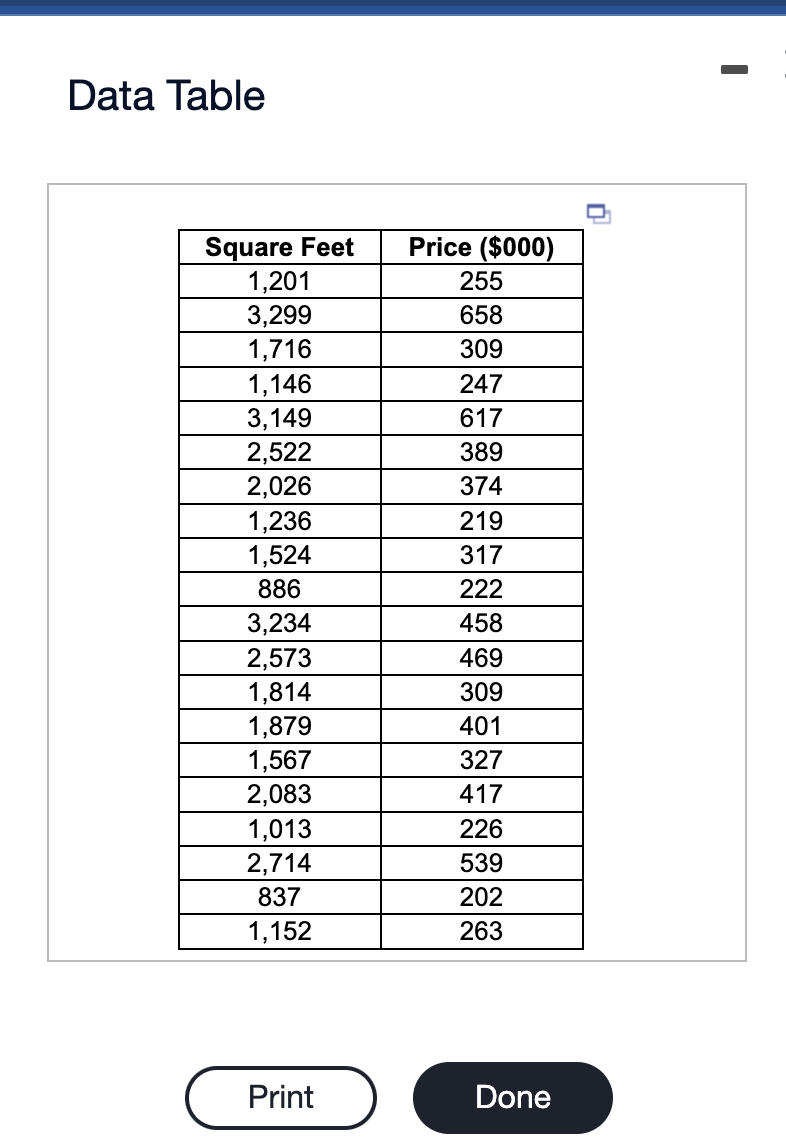
The accompanying data table contains the listed prices (in thousands of dollars) and the number of square feet for 20 homes listed by a realtor in a certain city. Complete parts a through f below. Click the icon to view the data table. (a) Create a scatterplot for the price of the home on the number of square feet. Does the trend in the average price seem linear? Construct the scatterplot. Choose the correct graph below. A. B. C. D. Does the trend in the average price seem linear? A. Yes, because the scatterplot does not show any obvious pattern. B. No, because the scatterplot does not show any obvious pattern. C. No, because the scatterplot shows an obvious curved line. D. Yes, because the scatterplot shows an approximate linear pattern. (b) Estimate the linear equation using least squares. Interpret the fitted intercept and slope. Be sure to include their units. Note if either estimate represents a large extrapolation and is consequently not reliable. Complete the equation for the fitted line below. Estimated Price ($000)=+ Size ( Square Feet) (Round to three decimal places as needed.) Data Table
Step by Step Solution
There are 3 Steps involved in it

Get step-by-step solutions from verified subject matter experts