

Question: please answer B)return on assets and C) return on common stockholders equity Question 7 of 8 Sandhill Medical manufactures hospital beds and other institutional furniture.
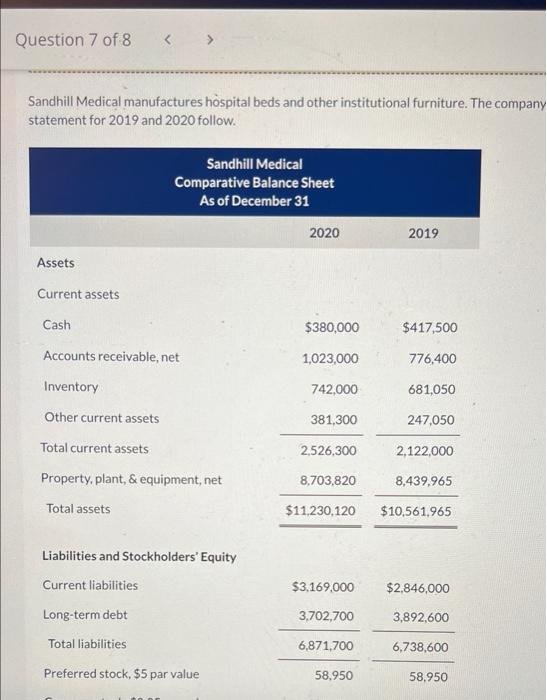
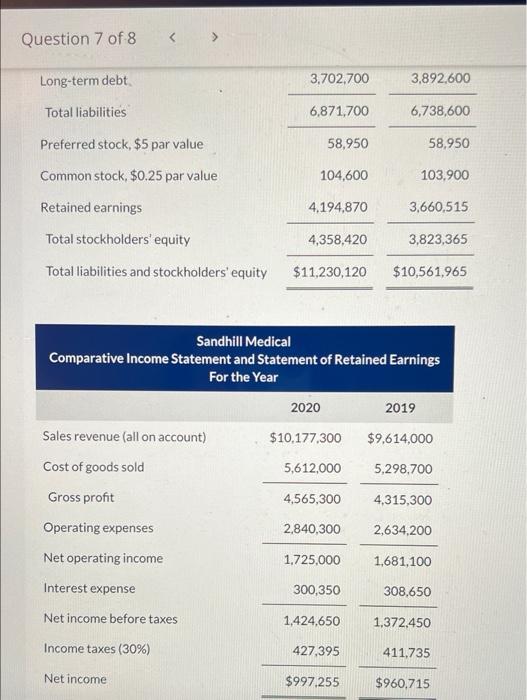
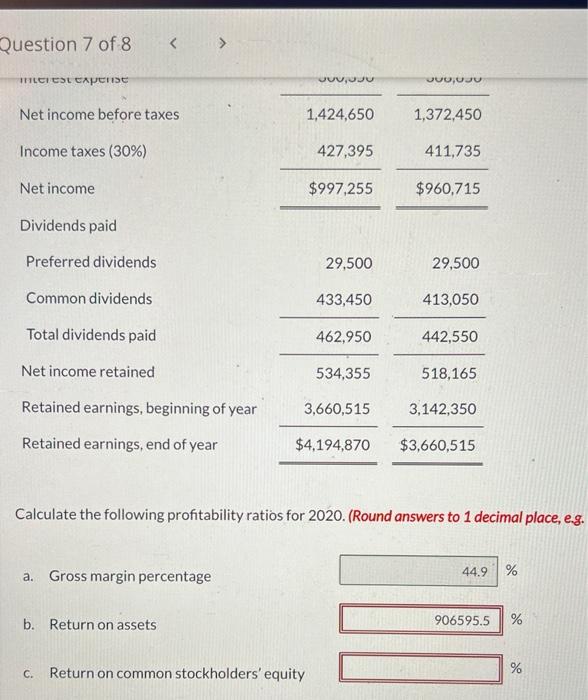
Question 7 of 8 Sandhill Medical manufactures hospital beds and other institutional furniture. The company statement for 2019 and 2020 follow. Assets Current assets Cash Sandhill Medical Comparative Balance Sheet As of December 31 Accounts receivable, net Inventory Other current assets Total current assets Property, plant, & equipment, net Total assets Liabilities and Stockholders' Equity Current liabilities Long-term debt Total liabilities Preferred stock, $5 par value 2020 $380,000 1,023,000 742,000 381,300 2,526,300 8,703,820 $11,230,120 $3,169,000 3,702,700 6,871,700 58,950 2019 $417,500 776,400 681,050 247,050 2,122,000 8,439,965 $10,561,965 $2,846,000 3,892,600 6,738,600 58,950 Question 7 of 8 Long-term debt. Total liabilities Preferred stock, $5 par value Common stock, $0.25 par value Sales revenue (all on account) Cost of goods sold Gross profit Operating expenses 3,702,700 6,871,700 Net operating income Interest expense Net income before taxes Income taxes (30%) 58,950 Net income 104,600 Retained earnings 3,660,515 Total stockholders' equity 4,358,420 3,823,365 Total liabilities and stockholders' equity $11,230,120 $10,561,965 4,194,870 Sandhill Medical Comparative Income Statement and Statement of Retained Earnings For the Year 2020 $10,177,300 5,612,000 4,565,300 2,840,300 1,725,000 300,350 3,892,600 6,738,600 58,950 1,424,650 103,900 427,395 $997,255 2019 $9,614,000 5,298,700 4,315,300 2,634,200 1,681,100 308,650 1,372,450 411,735 $960,715 Question 7 of 8 Interest Expense Net income before taxes Income taxes (30%) Net income Dividends paid Preferred dividends Common dividends Total dividends paid Net income retained Retained earnings, beginning of year Retained earnings, end of year a. Gross margin percentage b. Return on assets 356,350 1,424,650 427,395 C. Return on common stockholders' equity $997,255 29,500 433,450 462,950 534,355 3,660,515 $4,194,870 3,00 USUGAN 1,372,450 411,735 $960,715 29,500 413,050 442,550 Calculate the following profitability ratios for 2020. (Round answers to 1 decimal place, e.g. 518,165 3,142,350 $3,660,515 44.9 % de 906595.5 do % %
Step by Step Solution
There are 3 Steps involved in it

Get step-by-step solutions from verified subject matter experts