

Question: please answer carefullt with detailed minimum two explanation points Interfere density M Interfere 12. Use jamovi to obtain a kernel density plot for the INTERFERE
please answer carefullt with detailed minimum two explanation points
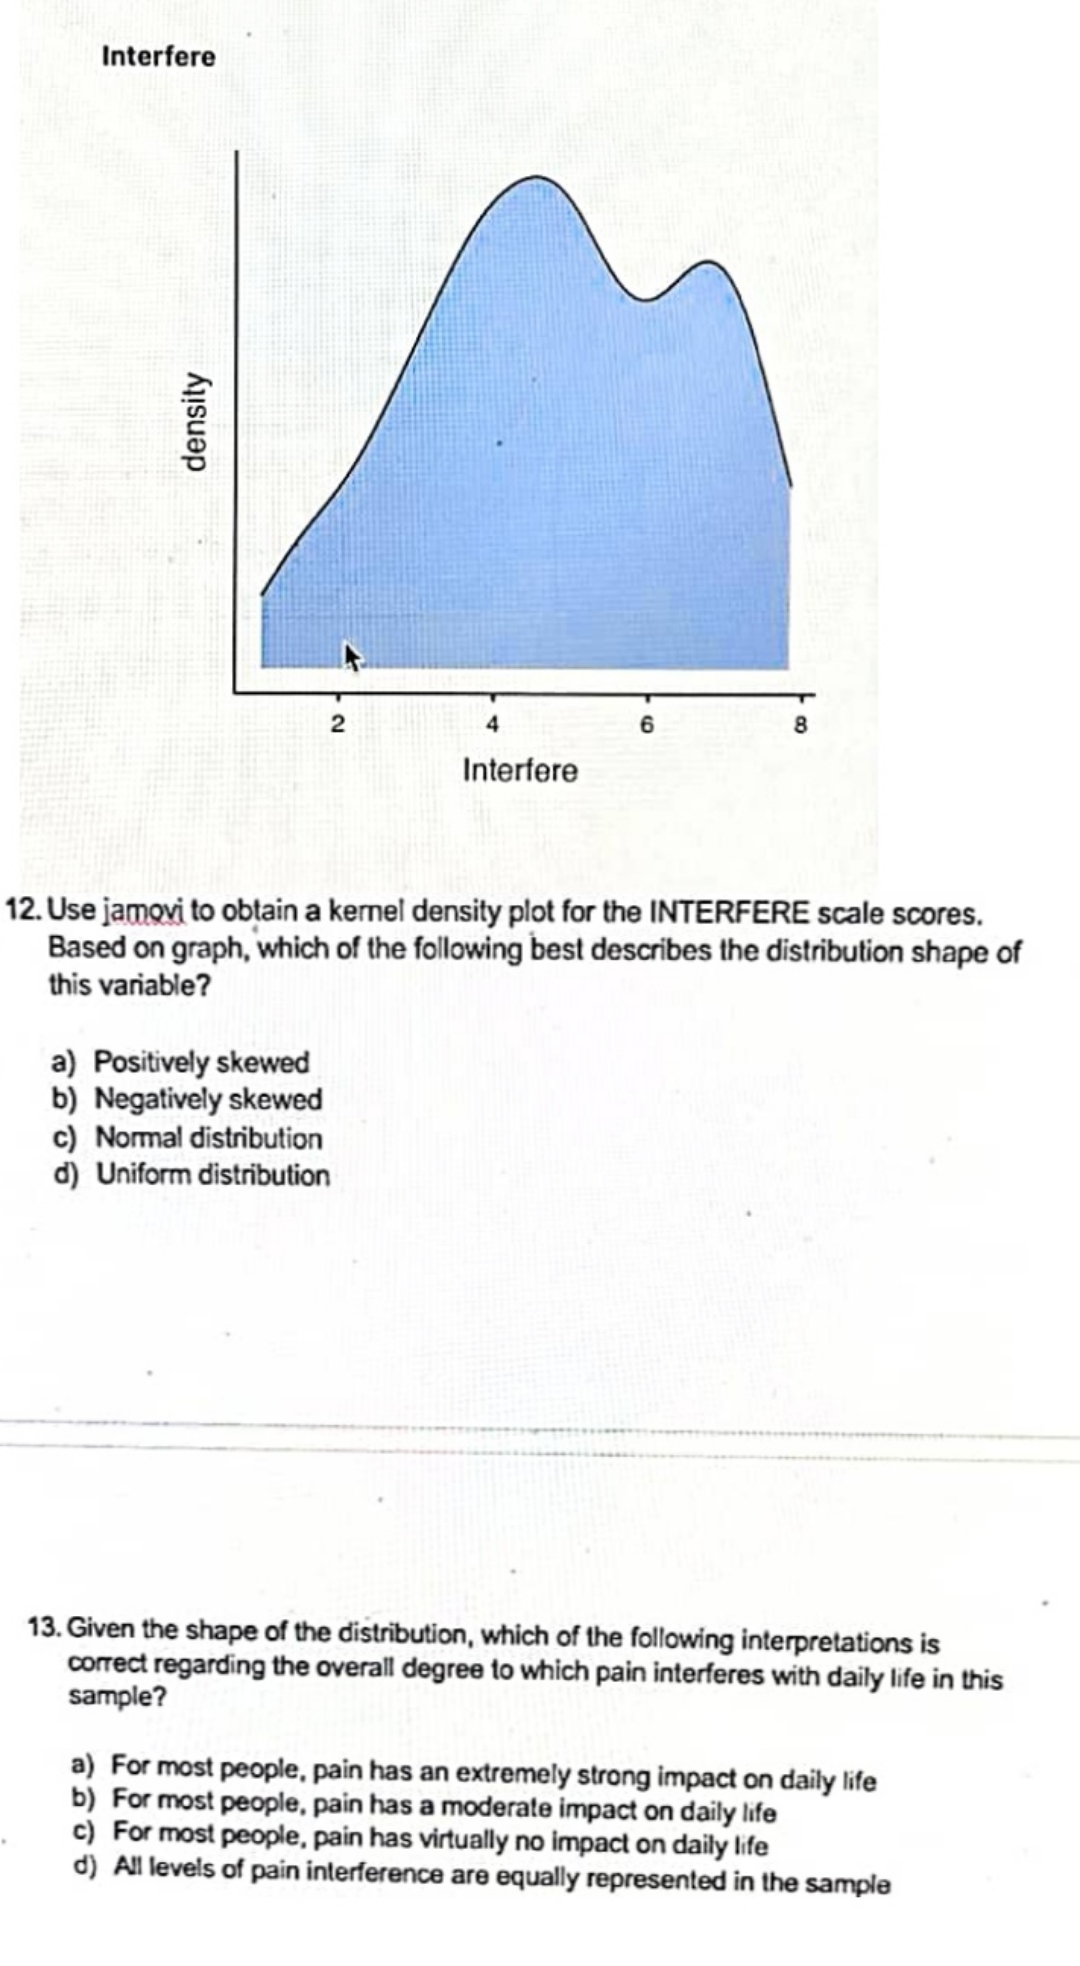
Interfere density M Interfere 12. Use jamovi to obtain a kernel density plot for the INTERFERE scale scores. Based on graph, which of the following best describes the distribution shape of this variable? a) Positively skewed b) Negatively skewed c) Normal distribution d) Uniform distribution 13. Given the shape of the distribution, which of the following interpretations is correct regarding the overall degree to which pain interferes with daily life in this sample? a) For most people, pain has an extremely strong impact on daily life b) For most people, pain has a moderate impact on daily life c) For most people, pain has virtually no impact on daily life d) All levels of pain interference are equally represented in the sample
Step by Step Solution
There are 3 Steps involved in it

Get step-by-step solutions from verified subject matter experts