

Question: Please answer clearly in the spss program, the answer from question (1-3) nt RE Patagraph Styles Student 1 2 4 5 6 7 8 9
Please answer clearly in the spss program, the answer from question (1-3) 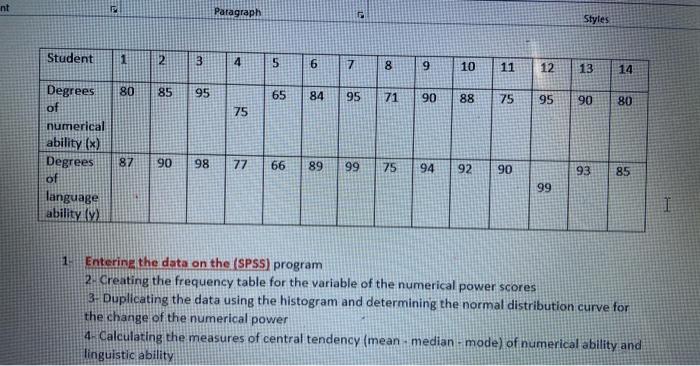
nt RE Patagraph Styles Student 1 2 4 5 6 7 8 9 10 11 12 13 14 80 85 95 65 84 95 71 90 88 75 95 90 80 75 Degrees of numerical ability (x) Degrees of language ability ) 87 90 98 77 66 89 99 75 94 92 90 93 85 99 I 1. Entering the data on the (SPSS) program 2. Creating the frequency table for the variable of the numerical power scores 3- Duplicating the data using the histogram and determining the normal distribution curve for the change of the numerical power 4. Calculating the measures of central tendency (mean median-mode) of numerical ability and linguistic ability
Step by Step Solution
There are 3 Steps involved in it
1 Expert Approved Answer
Step: 1 Unlock

Question Has Been Solved by an Expert!
Get step-by-step solutions from verified subject matter experts
Step: 2 Unlock
Step: 3 Unlock