

Question: Please answer Cleary, AND THIS THE FULL QUESTION. The plot below appeared in a report called Smoking and Health (US Surgeon-General, January 1964) to summarize
Please answer Cleary, AND THIS THE FULL QUESTION.
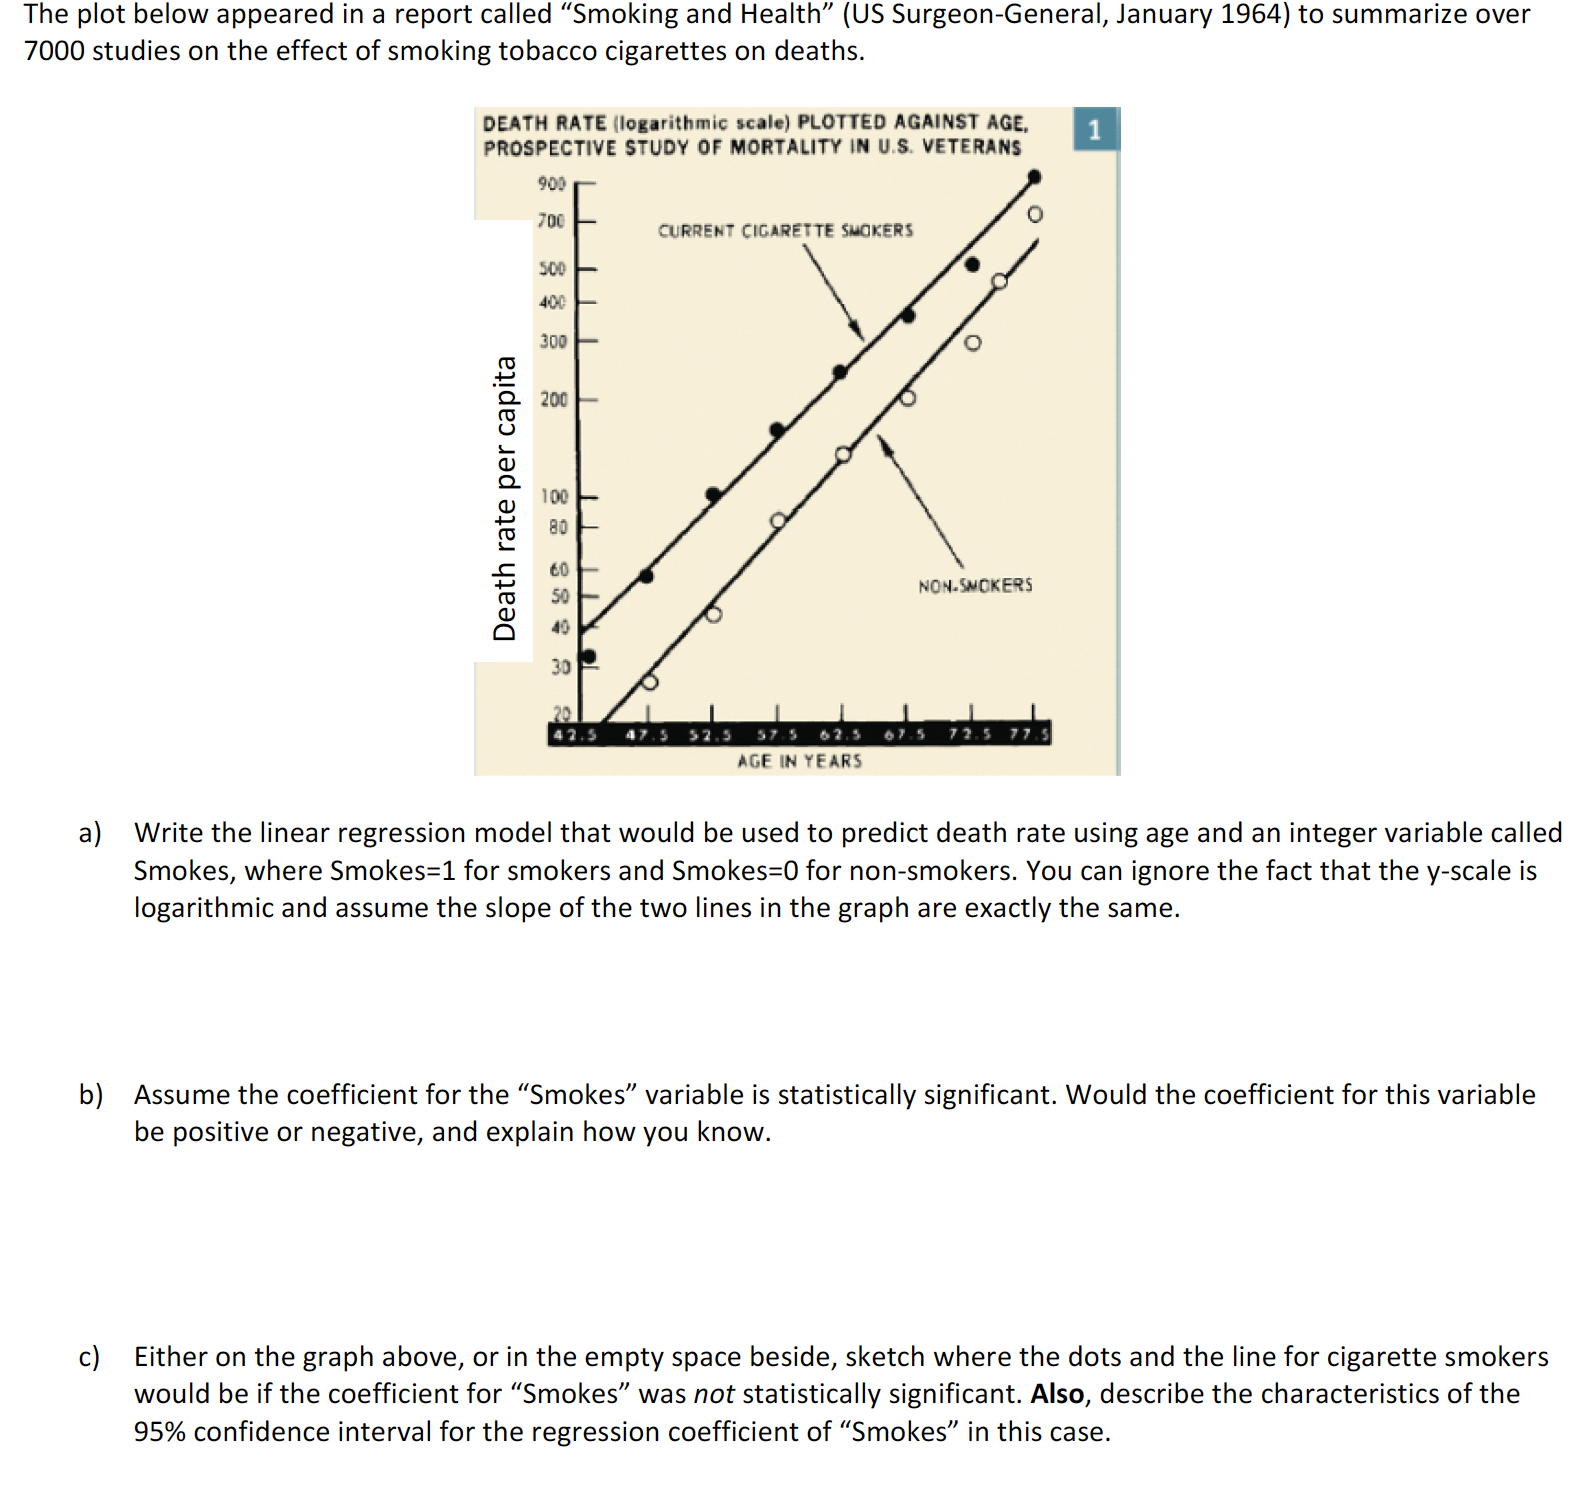
The plot below appeared in a report called "Smoking and Health" (US Surgeon-General, January 1964) to summarize over 7000 studies on the effect of smoking tobacco cigarettes on deaths. DEATH RATE (logarithmic scale) PLOTTED AGAINST AGE, PROSPECTIVE STUDY OF MORTALITY IN U.S. VETERANS 1 900 70C CURRENT CIGARETTE SMOKERS 500 300 Death rate per capita 200 100 NON SMOKERS 43.5 47.5 3 62.5 AGE IN YEARS a) Write the linear regression model that would be used to predict death rate using age and an integer variable called Smokes, where Smokes=1 for smokers and Smokes=0 for non-smokers. You can ignore the fact that the y-scale is logarithmic and assume the slope of the two lines in the graph are exactly the same. b) Assume the coefficient for the "Smokes" variable is statistically significant. Would the coefficient for this variable be positive or negative, and explain how you know. c) Either on the graph above, or in the empty space beside, sketch where the dots and the line for cigarette smokers would be if the coefficient for "Smokes" was not statistically significant. Also, describe the characteristics of the 95% confidence interval for the regression coefficient of "Smokes" in this case
Step by Step Solution
There are 3 Steps involved in it

Get step-by-step solutions from verified subject matter experts