

Question: Please answer correctly with explanation and please do not copper paste from other websites. I only need 1,3,5,7 and the question I the last image
Please answer correctly with explanation and please do not copper paste from other websites. I only need 1,3,5,7 and the question I the last image
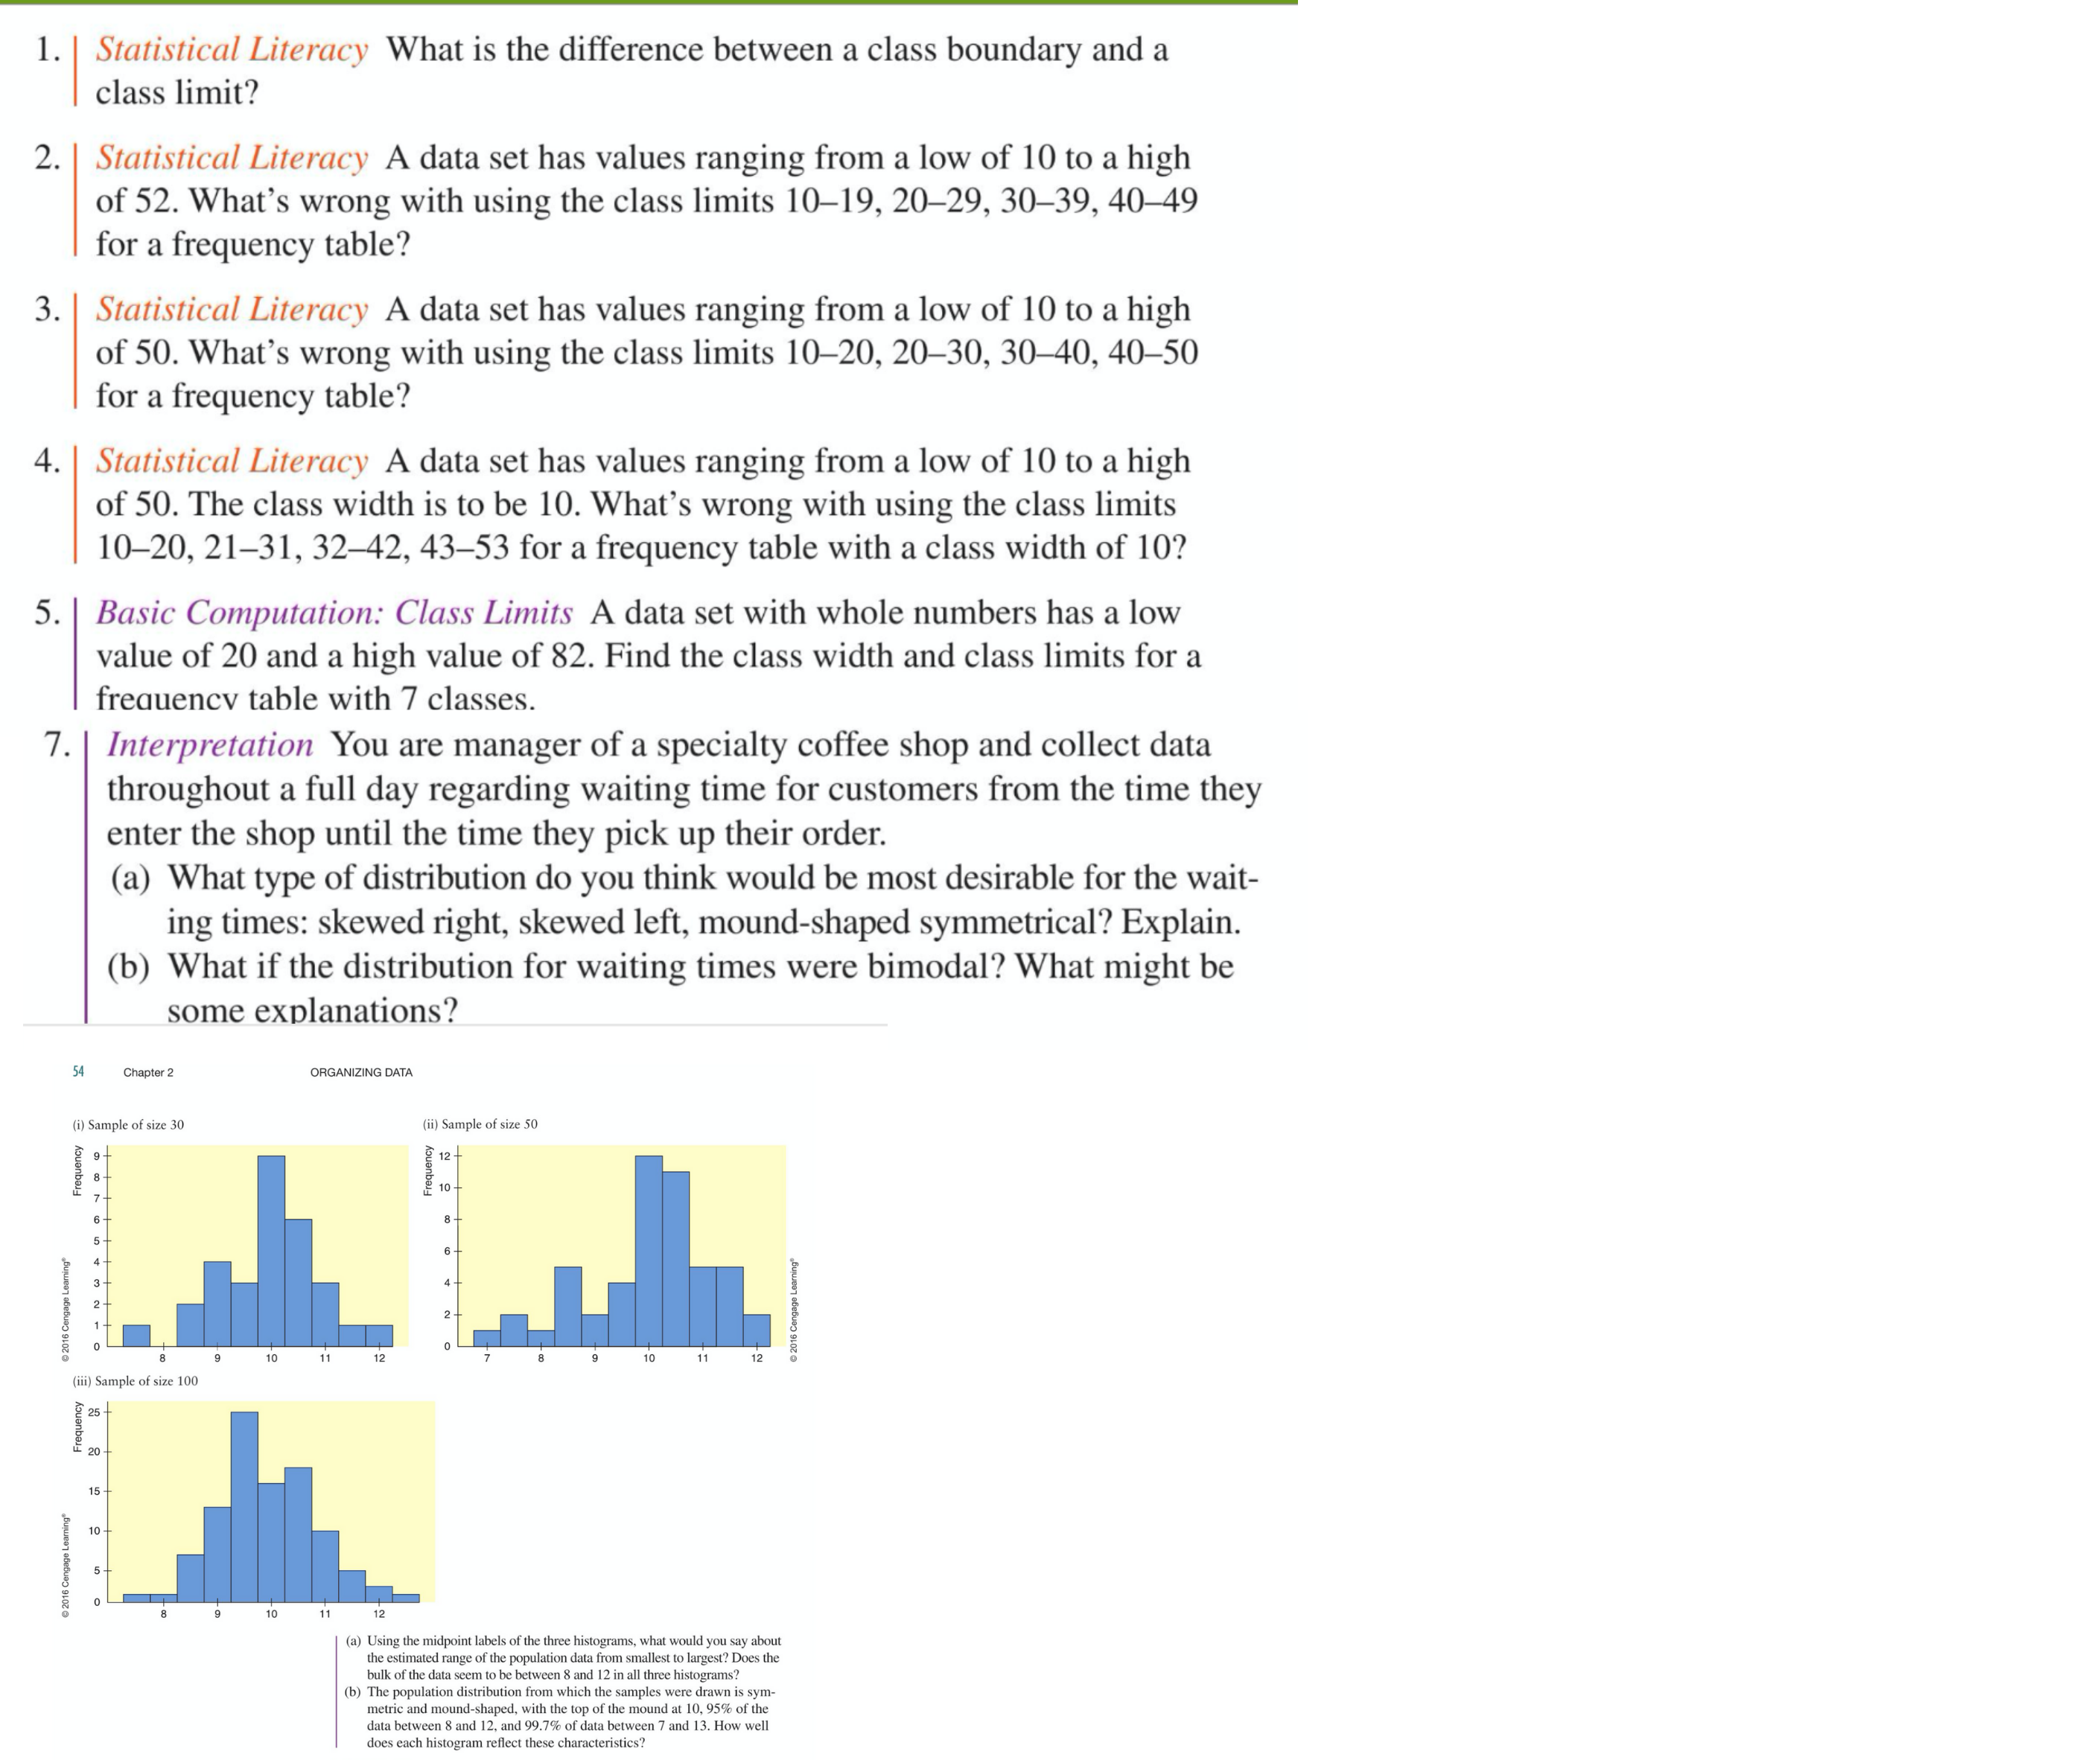
1. | Statistical Literacy What is the difference between a class boundary and a class limit? 2. | Statistical Literacy A data set has values ranging from a low of 10 to a high of 52. What's wrong with using the class limits 10-19, 20-29, 30-39, 40-49 for a frequency table? 3. | Statistical Literacy A data set has values ranging from a low of 10 to a high of 50. What's wrong with using the class limits 10-20, 20-30, 30-40, 40-50 for a frequency table? 4. | Statistical Literacy A data set has values ranging from a low of 10 to a high of 50. The class width is to be 10. What's wrong with using the class limits 10-20, 21-31, 32-42, 43-53 for a frequency table with a class width of 10? 5. | Basic Computation: Class Limits A data set with whole numbers has a low value of 20 and a high value of 82. Find the class width and class limits for a frequency table with 7 classes. 7. | Interpretation You are manager of a specialty coffee shop and collect data throughout a full day regarding waiting time for customers from the time they enter the shop until the time they pick up their order. (a) What type of distribution do you think would be most desirable for the wait- ing times: skewed right, skewed left, mound-shaped symmetrical? Explain. (b) What if the distribution for waiting times were bimodal? What might be some explanations? Chapter 2 ORGANIZING DATA (i) Sample of size 30 (ii) Sample of size 50 12- g 10 - 2016 Cengage Le . 2016 Cengage Learning (iii) Sample of size 100 Frequer e Learning' 12 (a) Using the midpoint labels of the three histograms, what would you say about the estimated range of the population data from smallest to largest? Does the bulk of the data seem to be between 8 and 12 in all three histograms? tribution from which the sam ere drawn is sym metric and mound-shaped, with the top of the mound at 10, 95% of the tween 8 and 12, and 99.7% of data between 7 and 13. How well does each histogram reflect these characteristics
Step by Step Solution
There are 3 Steps involved in it

Get step-by-step solutions from verified subject matter experts