

Question: please answer d and e question by using this graph Price $30- 100 200 300 400 600 600 700 800 Quantity a. In this market,
please answer d and e question by using this graph
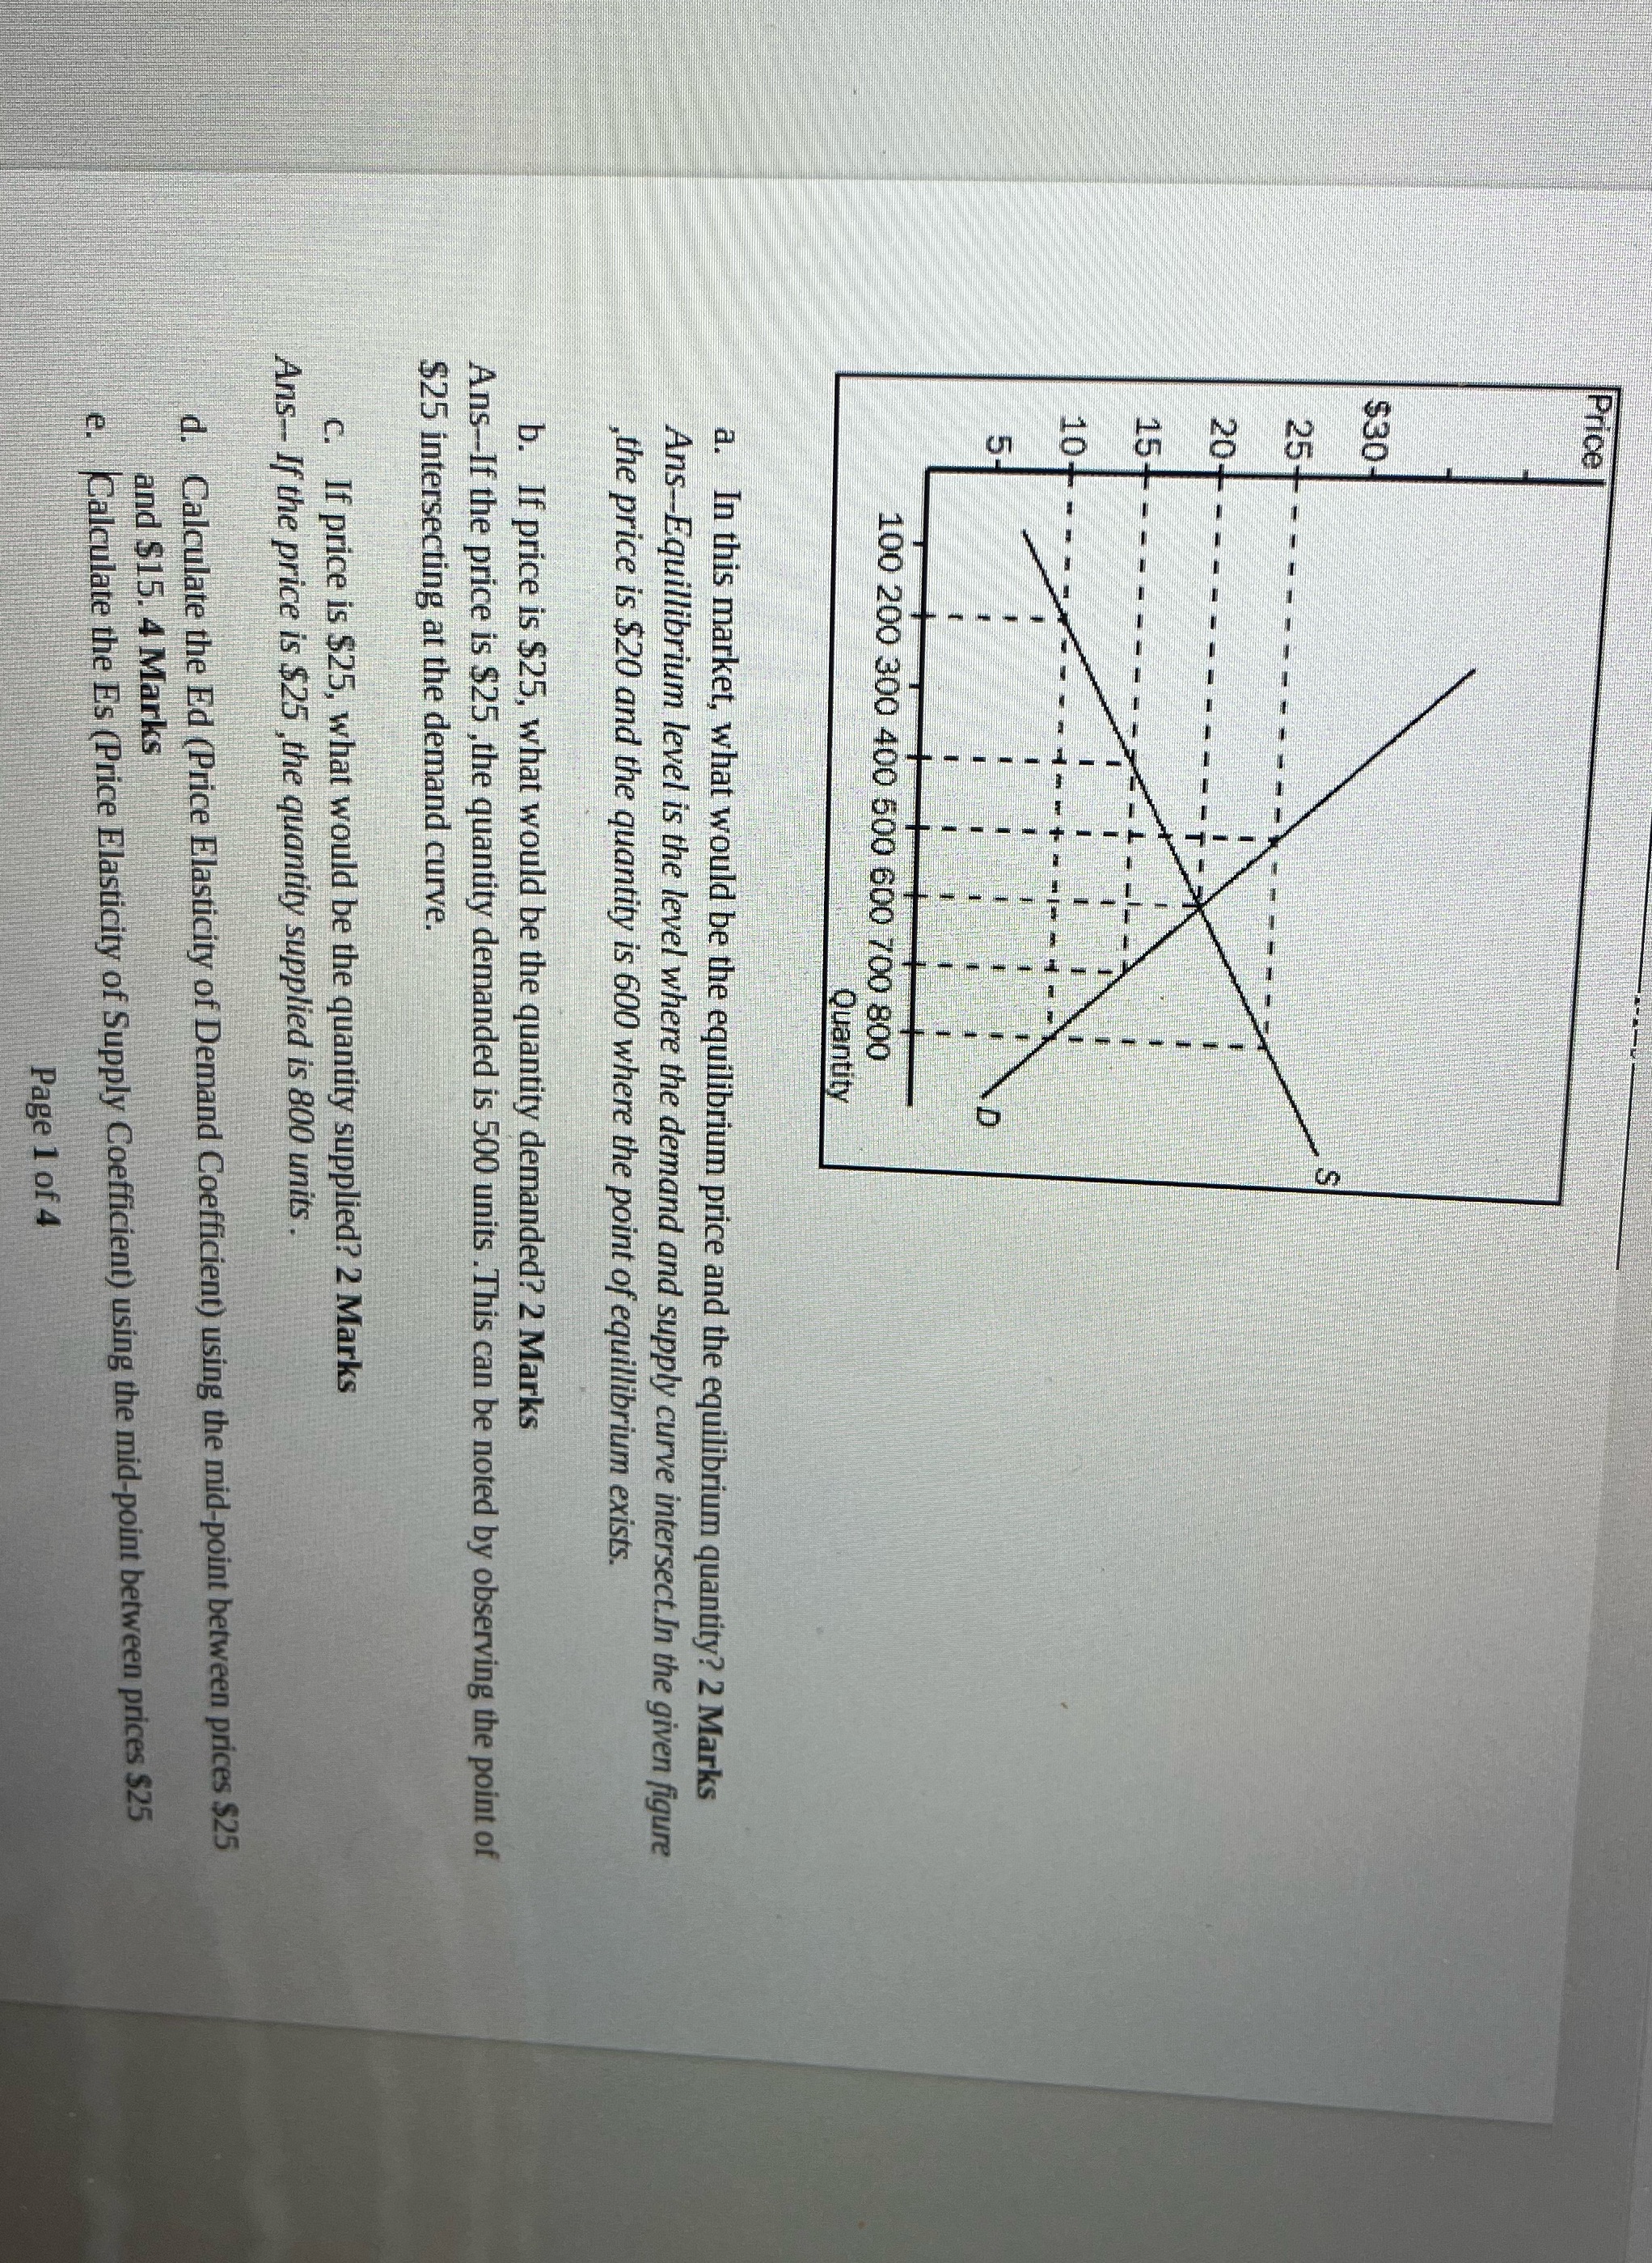
Price $30- 100 200 300 400 600 600 700 800 Quantity a. In this market, what would be the equilibrium price and the equilibrium quantity? 2 Marks Ans-Equillibrium level is the level where the demand and supply curve intersect. In the given figure the price is $20 and the quantity is 600 where the point of equillibrium exists. b. If price is $25, what would be the quantity demanded? 2 Marks Ans--If the price is $25 , the quantity demanded is 500 units . This can be noted by observing the point of $25 intersecting at the demand curve. C. If price is $25, what would be the quantity supplied? 2 Marks Ans-- If the price is $25 , the quantity supplied is 800 units . d. Calculate the Ed (Price Elasticity of Demand Coefficient) using the mid-point between prices $25 and $15. 4 Marks e. Calculate the Es (Price Elasticity of Supply Coefficient) using the mid-point between prices $25 Page 1 of 4
Step by Step Solution
There are 3 Steps involved in it

Get step-by-step solutions from verified subject matter experts