

Question: Please answer Did CFO to total debt increase or decrease in fiscal 2018 relative to fiscal 2017? Why? Does the change signal more or less
Please answer
- Did CFO to total debt increase or decrease in fiscal 2018 relative to fiscal 2017? Why? Does the change signal more or less credit risk?
- Did Debt to Equity increase or decrease in fiscal 2018 relative to fiscal 2017? Why? Does the change signal more or less risk?
- Please zoom in to the image to see numbers
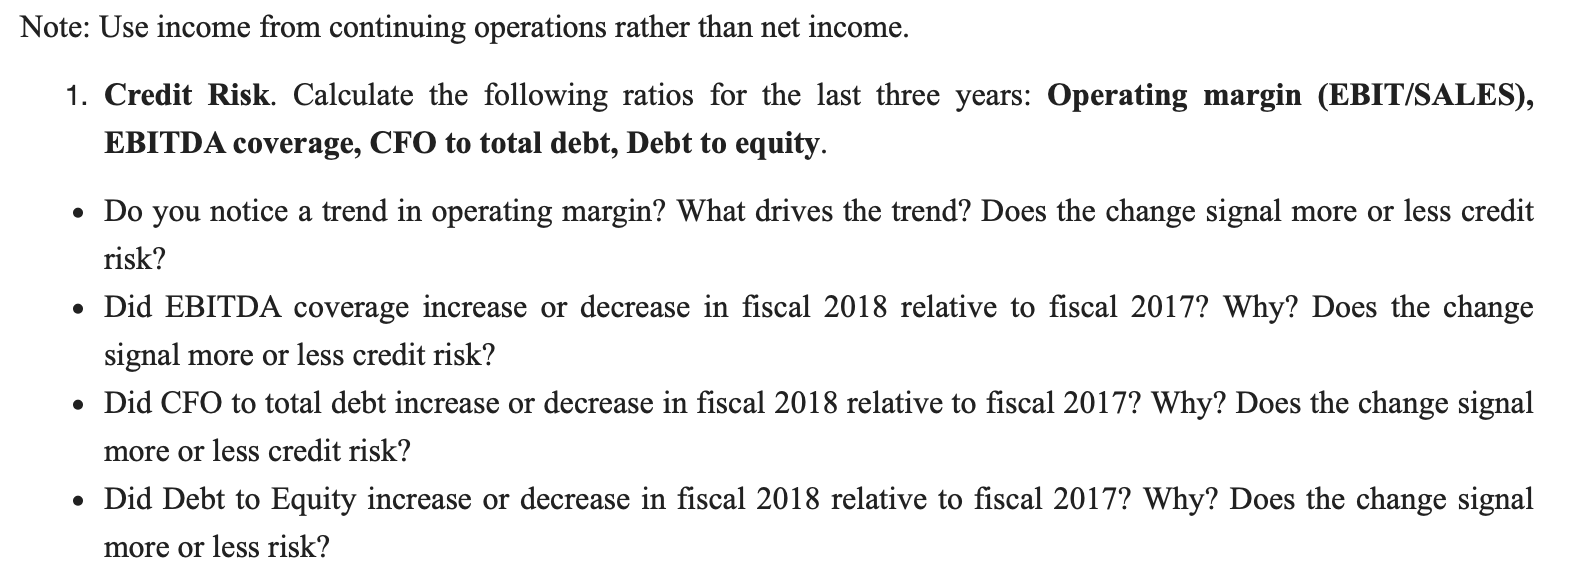
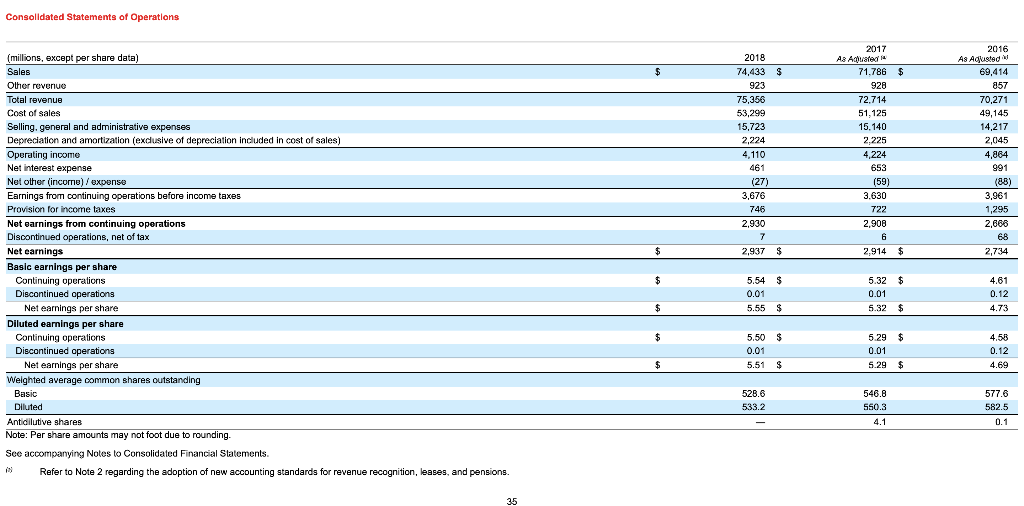


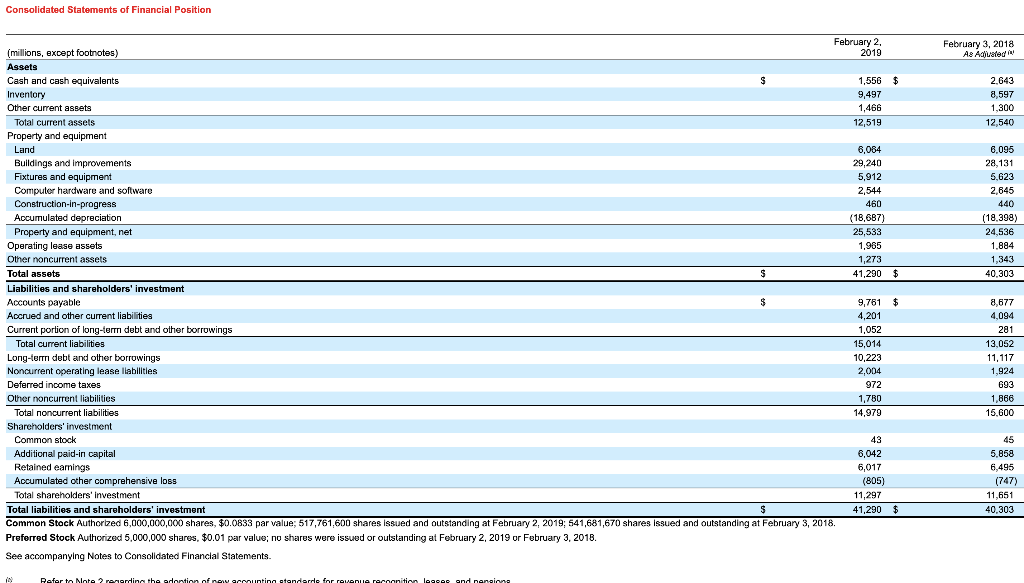
Note: Use income from continuing operations rather than net income. 1. Credit Risk. Calculate the following ratios for the last three years: Operating margin (EBIT/SALES), EBITDA coverage, CFO to total debt, Debt to equity. Do you notice a trend in operating margin? What drives the trend? Does the change signal more or less credit risk? Did EBITDA coverage increase or decrease in fiscal 2018 relative to fiscal 2017? Why? Does the change signal more or less credit risk? Did CFO to total debt increase or decrease in fiscal 2018 relative to fiscal 2017? Why? Does the change signal more or less credit risk? Did Debt to Equity increase or decrease in fiscal 2018 relative to fiscal 2017? Why? Does the change signal more or less risk? Consolidated Statements of Operations 2017 $ 2018 74,433 $ 923 75,356 53,299 15,723 2,224 4,110 461 (27) 3,676 746 2,930 71.786 928 72,714 51,125 15.140 2,225 4,224 653 (59) 3.630 722 2,908 2016 As Agusted 69,414 857 70,271 49,145 14,217 2,045 4,864 991 (88) 3,961 1.295 2,666 6 2,937 $ 2,914 $ 2,734 (millions, except per share data) Sales Other revenue Total revenue Cost of sales Selling, general and administrative expenses Depreciation and amortization (exclusive of depreciation included in cost of sales) Operating income Net interest expense Net other (income) / expense Earnings from continuing operations before income taxes Provision for Income taxes Net earnings from continuing operations Discontinued operations, net of tax Net earnings Basic earnings per share Continuing operations Discontinued operations Net earnings per share Diluted earnings per share Continuing operations Discontinued operations Net earnings per share Weighted average common shares outstanding Basic Diluted Antidilutive shares Note: Per share amounts may not foot due to rounding. See accompanying Notes to Consolidated Financial Statements. 13 Refer to Note 2 regarding the adoption of new accounting standards for revenue recognition, leases, and pensions. $ $ 5.54 0.01 5.55 5.32 0.01 5.32 4.61 0.12 4.73 $ $ $ 5.50 $ 0.01 5.51 $ 5.29 0.01 5.29 4.55 0.12 $ 4.69 528.6 533.2 546.8 550.3 4.1 577.6 582.5 0.1 Consolidated Statements of Comprehensive Income 2018 2,937 2017 As Adjusted (a) 2,914 2016 As Adjusted (a) 2,734 $ $ (millions) Net earnings Other comprehensive (loss)/income, net of tax Pension and other benefit liabilities, net of tax Currency translation adjustment and cash flow hedges, net of tax Other comprehensive (loss)/income Comprehensive income 2 (52) (6) (58) 2,879 8 2,922 (13) 4 (9) 2,725 $ $ $ See accompanying Notes to Consolidated Financial Statements. (a) Refer to Note 2 regarding the adoption of new accounting standards for revenue recognition, leases, and pensions. Consolidated Statements of Cash Flows 2016 2018 2017 As Adjusted As Adjusted 2,837 2.814 S 2.734 2.00 2,566 2,474 2,476 132 2,312 113 112 322 (189) 123 200 422 95 (11) (900) (29951) 283 1.127 (348) (15 il 1.307 419 5,161 74 6,935 (168) (294) 5,8701 107 5,973 5,444 {milians) Operating activities Net eaminge Earnings from discontinued aperations. Act of tax Net samings from continung operations Adjustments to reconcile net earnings to cash provided by operatione: Depreciation and amart zatian Share-based compensation expense Deferrad income taxes Loes on debt extinguishment Moncash kassigains and other net Changes in operating accounts: Inventory Other Assets Adonis pavable Accrued and ather liabilities Cash provided by operating activities-continuing operations Casis provided by operating activities discontinued operations Cash provided by operations Investing activities Expenditures for property and ecuioment Proceeds from dispasal of properly and equipment Cash paid for acquisitions, not of cash assumed Other investments Cash required for investing activities Financing activities Additions to long-term deb! Reductions of long-term deb Dividends paid Repurchase of stock Stock option verdaes Cash required for financing activities Nel decrease increase in cash and casi equivalents Cash and cash equivalents at beginnng of penod Cash And cash equivalents At end of period Supplemental information Interest paid, net of capitalized interest Income taxes old Leased assets abtained in exchange for new finance lease liabilities Tasar assas obtained in exchange for new aparating RASA lahities (3.516) 12.533) 11.547) (518) (55) 13.416) 13.075) (1.473) 739 (281) (1.335) (2,124) 1.977 12,849 11.348) 13,708) 12,192) 11.338) (1.048) 103 13.729) 131 2,512 2,643 (3,544) (1,087) 2.643 1,550 15,505) (1,534) 4.046 2.512 $ $ S 878 S 999 470 373 130 1.514 139 252 212 See accompanying Notes to Consolidated Financial Statements. Refer to Note 2 regarding the adoption of new accounting standards for revenue recognition, leases, and pensions. Consolidated Statements of Financial Position February 3, 2018 Ae Adivated $ 2.643 8,597 1,300 12,540 6.095 28,131 5,623 2,645 440 (18.398) 24,536 1,884 1,343 40.303 $ February 2, (millions, except footnotes) 2019 Assets Cash and cash equivalents 1,556 Inventory 9,497 Other current assets 1,466 Total current assets 12,519 Property and equipment Land 6,084 Buildings and improvements 29,240 Fixtures and equipment 5,912 Computer hardware and software 2,544 Construction-in-progress 460 Accumulated depreciation (18,687) Property and equipment, net 25,533 Operating lease assets 1,965 Other noncurrent assets 1,273 Total assets 41.290 Liabilities and shareholders' investment Accounts payable 9,761 Accrued and other current liabilities 4,201 Current portion of long-term debt and other borrowings 1,052 Total current liabilities 15,014 Long-term debt and other borrowings 10,223 Noncurrent operating lease liabilities 2,004 Deferred income taxes 972 Other noncurrent liabilities 1,780 Total noncurrent liabilities 14,979 Shareholders' investment Common stock Additional paid-in capital 6,042 Retained earings 6,017 Accumulated other comprehensive loss (805) Total shareholders' investment 11,297 Total liabilities and shareholders' investment 41,290 Common Stock Authorized 6,000,000,000 shares. $0.0833 par value; 517,761,600 shares issued and outstanding at February 2, 2019, 541,681,670 shares issued and outstanding at February 3, 2018 Proforrod Stock Authorized 5,000,000 shares, $0.01 par value; no shares were issued or outstanding at February 2, 2019 or February 3, 2018 See accompanying Notes to Consolidated Financial Statements. $ 8,677 4,094 281 13.052 11, 117 1.924 693 1,866 15.600 5.858 6,495 (747) 11,651 40,303 $ in Refer to Note 2 renarding the adontion of new accounting standards for revenue recognition legges and pensions Note: Use income from continuing operations rather than net income. 1. Credit Risk. Calculate the following ratios for the last three years: Operating margin (EBIT/SALES), EBITDA coverage, CFO to total debt, Debt to equity. Do you notice a trend in operating margin? What drives the trend? Does the change signal more or less credit risk? Did EBITDA coverage increase or decrease in fiscal 2018 relative to fiscal 2017? Why? Does the change signal more or less credit risk? Did CFO to total debt increase or decrease in fiscal 2018 relative to fiscal 2017? Why? Does the change signal more or less credit risk? Did Debt to Equity increase or decrease in fiscal 2018 relative to fiscal 2017? Why? Does the change signal more or less risk? Consolidated Statements of Operations 2017 $ 2018 74,433 $ 923 75,356 53,299 15,723 2,224 4,110 461 (27) 3,676 746 2,930 71.786 928 72,714 51,125 15.140 2,225 4,224 653 (59) 3.630 722 2,908 2016 As Agusted 69,414 857 70,271 49,145 14,217 2,045 4,864 991 (88) 3,961 1.295 2,666 6 2,937 $ 2,914 $ 2,734 (millions, except per share data) Sales Other revenue Total revenue Cost of sales Selling, general and administrative expenses Depreciation and amortization (exclusive of depreciation included in cost of sales) Operating income Net interest expense Net other (income) / expense Earnings from continuing operations before income taxes Provision for Income taxes Net earnings from continuing operations Discontinued operations, net of tax Net earnings Basic earnings per share Continuing operations Discontinued operations Net earnings per share Diluted earnings per share Continuing operations Discontinued operations Net earnings per share Weighted average common shares outstanding Basic Diluted Antidilutive shares Note: Per share amounts may not foot due to rounding. See accompanying Notes to Consolidated Financial Statements. 13 Refer to Note 2 regarding the adoption of new accounting standards for revenue recognition, leases, and pensions. $ $ 5.54 0.01 5.55 5.32 0.01 5.32 4.61 0.12 4.73 $ $ $ 5.50 $ 0.01 5.51 $ 5.29 0.01 5.29 4.55 0.12 $ 4.69 528.6 533.2 546.8 550.3 4.1 577.6 582.5 0.1 Consolidated Statements of Comprehensive Income 2018 2,937 2017 As Adjusted (a) 2,914 2016 As Adjusted (a) 2,734 $ $ (millions) Net earnings Other comprehensive (loss)/income, net of tax Pension and other benefit liabilities, net of tax Currency translation adjustment and cash flow hedges, net of tax Other comprehensive (loss)/income Comprehensive income 2 (52) (6) (58) 2,879 8 2,922 (13) 4 (9) 2,725 $ $ $ See accompanying Notes to Consolidated Financial Statements. (a) Refer to Note 2 regarding the adoption of new accounting standards for revenue recognition, leases, and pensions. Consolidated Statements of Cash Flows 2016 2018 2017 As Adjusted As Adjusted 2,837 2.814 S 2.734 2.00 2,566 2,474 2,476 132 2,312 113 112 322 (189) 123 200 422 95 (11) (900) (29951) 283 1.127 (348) (15 il 1.307 419 5,161 74 6,935 (168) (294) 5,8701 107 5,973 5,444 {milians) Operating activities Net eaminge Earnings from discontinued aperations. Act of tax Net samings from continung operations Adjustments to reconcile net earnings to cash provided by operatione: Depreciation and amart zatian Share-based compensation expense Deferrad income taxes Loes on debt extinguishment Moncash kassigains and other net Changes in operating accounts: Inventory Other Assets Adonis pavable Accrued and ather liabilities Cash provided by operating activities-continuing operations Casis provided by operating activities discontinued operations Cash provided by operations Investing activities Expenditures for property and ecuioment Proceeds from dispasal of properly and equipment Cash paid for acquisitions, not of cash assumed Other investments Cash required for investing activities Financing activities Additions to long-term deb! Reductions of long-term deb Dividends paid Repurchase of stock Stock option verdaes Cash required for financing activities Nel decrease increase in cash and casi equivalents Cash and cash equivalents at beginnng of penod Cash And cash equivalents At end of period Supplemental information Interest paid, net of capitalized interest Income taxes old Leased assets abtained in exchange for new finance lease liabilities Tasar assas obtained in exchange for new aparating RASA lahities (3.516) 12.533) 11.547) (518) (55) 13.416) 13.075) (1.473) 739 (281) (1.335) (2,124) 1.977 12,849 11.348) 13,708) 12,192) 11.338) (1.048) 103 13.729) 131 2,512 2,643 (3,544) (1,087) 2.643 1,550 15,505) (1,534) 4.046 2.512 $ $ S 878 S 999 470 373 130 1.514 139 252 212 See accompanying Notes to Consolidated Financial Statements. Refer to Note 2 regarding the adoption of new accounting standards for revenue recognition, leases, and pensions. Consolidated Statements of Financial Position February 3, 2018 Ae Adivated $ 2.643 8,597 1,300 12,540 6.095 28,131 5,623 2,645 440 (18.398) 24,536 1,884 1,343 40.303 $ February 2, (millions, except footnotes) 2019 Assets Cash and cash equivalents 1,556 Inventory 9,497 Other current assets 1,466 Total current assets 12,519 Property and equipment Land 6,084 Buildings and improvements 29,240 Fixtures and equipment 5,912 Computer hardware and software 2,544 Construction-in-progress 460 Accumulated depreciation (18,687) Property and equipment, net 25,533 Operating lease assets 1,965 Other noncurrent assets 1,273 Total assets 41.290 Liabilities and shareholders' investment Accounts payable 9,761 Accrued and other current liabilities 4,201 Current portion of long-term debt and other borrowings 1,052 Total current liabilities 15,014 Long-term debt and other borrowings 10,223 Noncurrent operating lease liabilities 2,004 Deferred income taxes 972 Other noncurrent liabilities 1,780 Total noncurrent liabilities 14,979 Shareholders' investment Common stock Additional paid-in capital 6,042 Retained earings 6,017 Accumulated other comprehensive loss (805) Total shareholders' investment 11,297 Total liabilities and shareholders' investment 41,290 Common Stock Authorized 6,000,000,000 shares. $0.0833 par value; 517,761,600 shares issued and outstanding at February 2, 2019, 541,681,670 shares issued and outstanding at February 3, 2018 Proforrod Stock Authorized 5,000,000 shares, $0.01 par value; no shares were issued or outstanding at February 2, 2019 or February 3, 2018 See accompanying Notes to Consolidated Financial Statements. $ 8,677 4,094 281 13.052 11, 117 1.924 693 1,866 15.600 5.858 6,495 (747) 11,651 40,303 $ in Refer to Note 2 renarding the adontion of new accounting standards for revenue recognition legges and pensions
Step by Step Solution
There are 3 Steps involved in it

Get step-by-step solutions from verified subject matter experts