

Question: Please answer each question in excel using the information down below. Show the formula text you used and explanation for each question. Here is the
Please answer each question in excel using the information down below. Show the formula text you used and explanation for each question.
Here is the information:
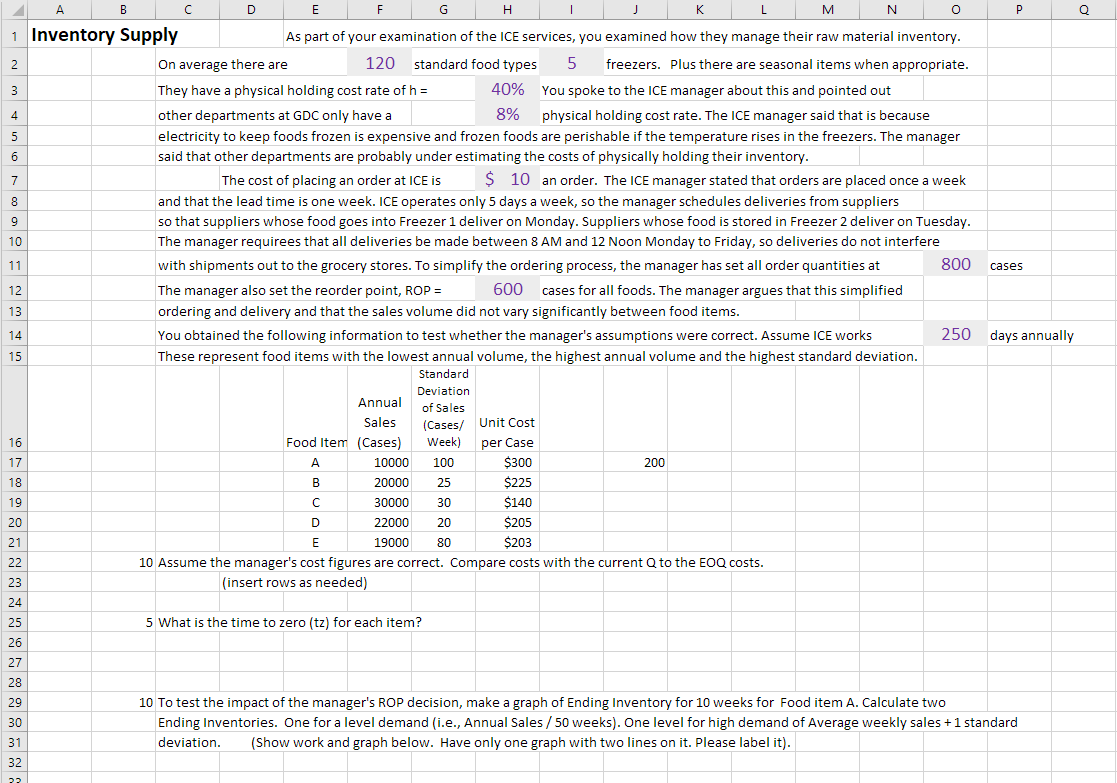
As part of your examination of the ICE services, you examined how they manage their raw material inventory. On average there are 120 standard food types in 5 freezers.Plus there are seasonal items when appropriate. They have a physical holding cost rate of h = 40% You spoke to the ICE manager about this and pointed out other departments at GDC only have a 8% physical holding cost rate. The ICE manager said that is because electricity to keep foods frozen is expensive and frozen foods are perishable if the temperature rises in the freezers. The manager said that other departments are probably under estimating the costs of physically holding their inventory. The cost of placing an order at ICE is $10 an order.The ICE manager stated that orders are placed once a week and that the lead time is one week. ICE operates only 5 days a week, so the manager schedules deliveries from suppliers so that suppliers whose food goes into Freezer 1 deliver on Monday. Suppliers whose food is stored in Freezer 2 deliver on Tuesday. The manager requirees that all deliveries be made between 8 AM and 12 Noon Monday to Friday, so deliveries do not interfere with shipments out to the grocery stores. To simplify the ordering process, the manager has set all order quantities at 800 cases The manager also set the reorder point, ROP = 600 cases for all foods. The manager argues that this simplified ordering and delivery and that the sales volume did not vary significantly between food items. You obtained the following information to test whether the manager's assumptions were correct. Assume ICE works 250 days annually These represent food items with the lowest annual volume, the highest annual volume and the highest standard deviation.
Table:
Food Item Annual Sales (Cases) Standard Deviation of Sales (Cases/ Week) Unit Cost per Case A 10000 100 $300
B 20000 25 $225
C 30000 30 $140
D 22000 20 $205
E 19000 80 $203
- Assume the manager's cost figures are correct.Compare costs with the current Q to the EOQ costs.
- What is the time to zero (tz) for each item?
- To test the impact of the manager's ROP decision, make a graph of Ending Inventory for 10 weeks forFood item A. Calculate two Ending Inventories.One for a level demand (i.e., Annual Sales / 50 weeks). One level for high demand of Average weekly sales + 1 standard deviation.(Show work and graph below.Have only one graph with two lines on it. Please label it).
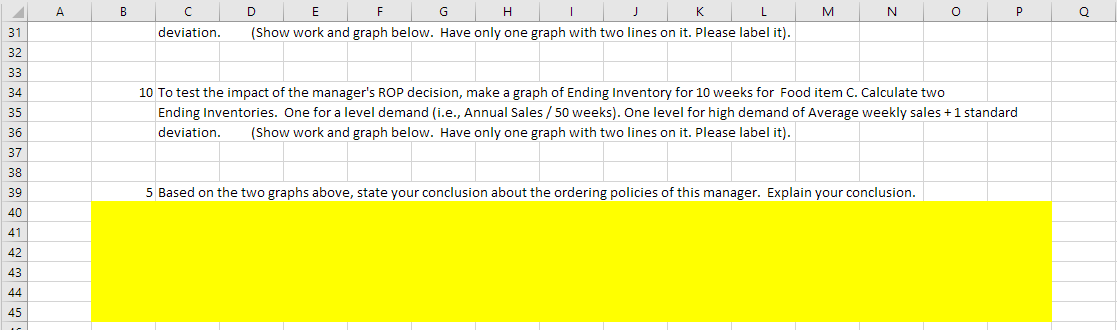
- To test the impact of the manager's ROP decision, make a graph of Ending Inventory for 10 weeks forFood item C. Calculate two Ending Inventories.One for a level demand (i.e., Annual Sales / 50 weeks). One level for high demand of Average weekly sales + 1 standard deviation.(Show work and graph below.Have only one graph with two lines on it. Please label it).
- Based on the two graphs above, state your conclusion about the ordering policies of this manager.Explain your conclusion.
Screenshots of original question:
ICIDIEIFIGIHI'IJIKILIMINIOI deviation. [Showwork and graph below. Have only one graph with two lines on it. Please label it}. 10 Totestthe impact ofthe manager's ROP decision, make a graph of Ending lnventorvfor 10weeksfor Food item (3. Calculate two Ending Inventories. One for a level demand [i.e., Annual Salesf50weeks}. One level for high demand of Average weeklv sales+ 1 standard deviation. [Show work and graph below. Have only one graph with two lines on it. Please label it}. 5 Based on the two graphs above, state your conclusion about the ordering policies of this manager. Explain your conclusion. AIEICIDIEIFIGIHI'IJIKILIMINIOIPI II1\\I'BI1'tl3l'\\lr Supply As part of your examination of the ICE services, you examined how they manage their raw material inventory. IGIT- WI; |2 |a|m|m|~4 |"|'\"|\" |w I\" l' L 16 17 18 19 20 21 23 24 25 26 27 28 29 30 3 1 32 3:: On average there are 120 standard food types 5 freezers. Plusthere are seasonal itemswhen appropriate. They have a physical holding cost rate of h = 40% You spoke tothe ICE manager about this and pointed out other departments at GDC only have a 8% physical holding cost rate.The ICE manager said thatis because electricity to keep foodsfrozen is expensive and frozen foods are perishable if the temperature rises in the freezers. The manager said that other departments are probably under estimating the costs of physically holding their inventory. The cost of placing an order at ICE is S 10 an order. The ICE manager stated that orders are placed once a week and that the lead time is one week. ICE operates only5 days a week, so the manager schedules deliveries from suppliers so that suppliers whose food goes into Freezer 1 deliver on Monday. Suppliers whose food is stored in Freezer 2 deliver on Tuesday. The manager requirees that all deliveries be made between 8 AM and 12 Noon Monday to Friday, so deliveries do not interfere with shipments out to the grocery stores. To simplify the ordering process, the manager has set all order quantities at 800 The manager also set the reorder point, ROP : 600 casesfor all foods. The manager argues that this simplified ordering and delivery and that the sales volume did not vary significantly between food items. You obtained the following information to test whether the manager's assumptions we re correct. Assume ICE works 250 These represent food items with the lowest annual volume, the highest annual volume and the highest standard deviation. Standard Deviation Annual ofSales Sales (Cases; Unit Cost Food lterr (Cases) Week] per Case A 10000 100 $300 200 B 20000 25 3225 C 30000 30 3140 D 22000 20 3205 E 19000 80 $203 10 Assume the manager's cost figures are correct. Compare costs with the current Clto the EOQ costs. [insert rows as needed} 5 what is the time to zero [tz} for each item? 10 To test the impact of the manager's ROP decision, make a graph of Ending Inventory for 10 weeks for Food item A. Calculate two C3595 days annually Ending Inventories. One for a level demand [i.e., Annual Salesll'50weeks}. One level for high demand of Average weekly sales+ 1 standard deviation. [Show work and graph below. Have only one graph with two lines on it. Please label it}
Step by Step Solution
There are 3 Steps involved in it

Get step-by-step solutions from verified subject matter experts