

Question: please answer esch clearly thanks Seconds 3) This graph represents 6.000 4,000 2,000 SD 520 540 560 580 $100 5 120 -2,000 -4,000 8.000 L
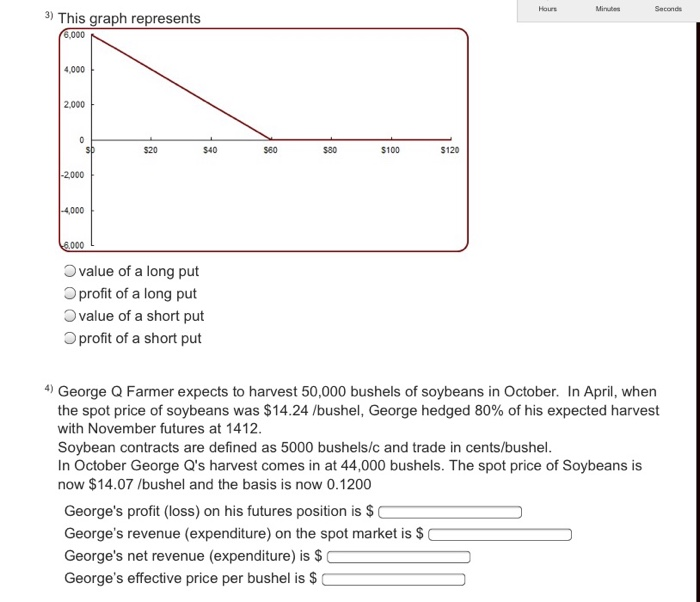
Seconds 3) This graph represents 6.000 4,000 2,000 SD 520 540 560 580 $100 5 120 -2,000 -4,000 8.000 L value of a long put Oprofit of a long put value of a short put Oprofit of a short put 4) George Q Farmer expects to harvest 50,000 bushels of soybeans in October. In April, when the spot price of soybeans was $14.24 /bushel, George hedged 80% of his expected harvest with November futures at 1412. Soybean contracts are defined as 5000 bushels/c and trade in cents/bushel. In October George Q's harvest comes in at 44,000 bushels. The spot price of Soybeans is now $14.07 /bushel and the basis is now 0.1200 George's profit (loss) on his futures position is $ George's revenue (expenditure) on the spot market is $ George's net revenue (expenditure) is $ George's effective price per bushel is $
Step by Step Solution
There are 3 Steps involved in it

Get step-by-step solutions from verified subject matter experts