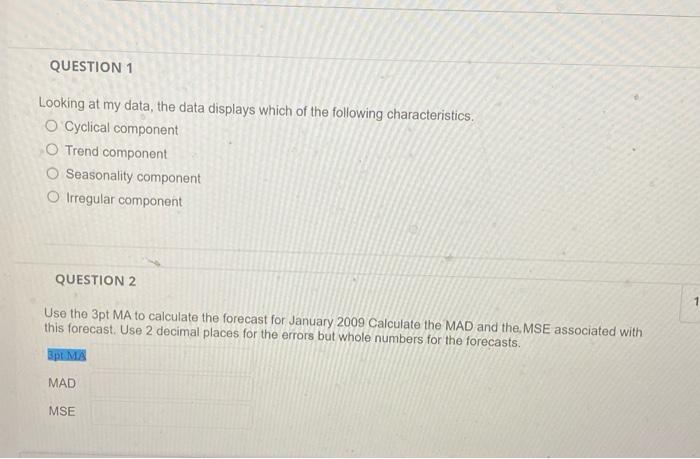
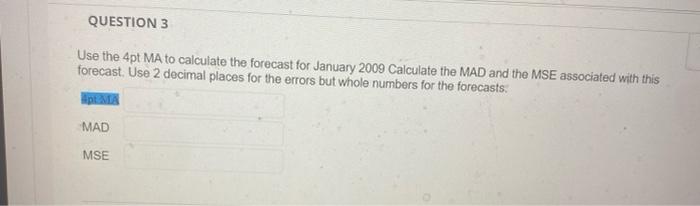
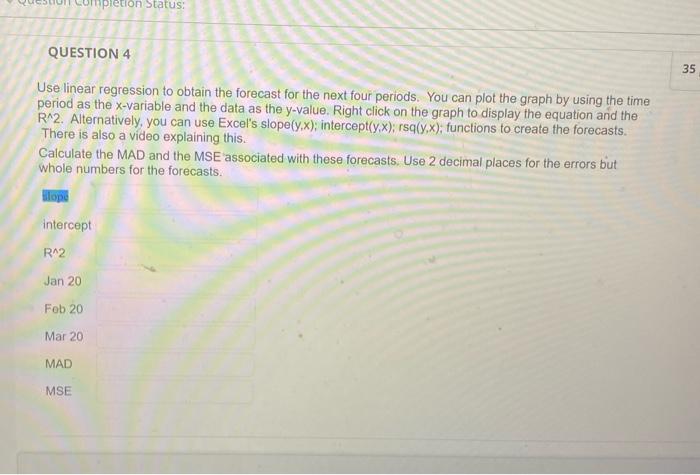
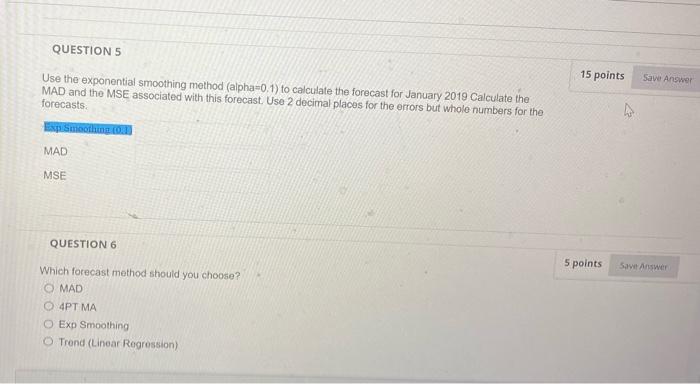
Question: please answer every question posted below. also please be ogranized and a straight foward answer when answering every question. thank you (added data posted in

please answer every question posted below. also please be ogranized and a straight foward answer when answering every question. thank you (added data posted in the last picture)

please answer every question posted below. also

please answer every question posted below. also

please answer every question posted below. also

please answer every question posted below. also

please answer every question posted below. also

please answer every question posted below. also

QUESTION 1 Looking at my data, the data displays which of the following characteristics. Cyclical component O Trend component O Seasonality component Irregular component QUESTION 2 1 Use the 3pt MA to calculate the forecast for January 2009 Calculate the MAD and the MSE associated with this forecast. Use 2 decimal places for the errors but whole numbers for the forecasts. pt M MAD MSE QUESTION 3 Use the 4pt MA to calculate the forecast for January 2009 Calculate the MAD and the MSE associated with this forecast. Use 2 decimal places for the errors but whole numbers for the forecasts. MA MAD MSE pletion Status: QUESTION 4 35 Use linear regression to obtain the forecast for the next four periods. You can plot the graph by using the time period as the x-variable and the data as the y-value, Right click on the graph to display the equation and the R^2. Alternatively, you can use Excel's slope(y,x); intercept(y,x);rsq(y,x); functions to create the forecasts. There is also a video explaining this. Calculate the MAD and the MSE associated with these forecasts. Use 2 decimal places for the errors but whole numbers for the forecasts. Hope intercept R^2 Jan 20 Feb 20 Mar 20 MAD MSE QUESTION 5 15 points Save Answer Use the exponential smoothing method (alpha=0.1) to calculate the forecast for January 2018 Calculate the MAD and the MSE associated with this forecast Use 2 decimal places for the errors but whole numbers for the forecasts Esp Smoothing.com MAD MSE QUESTION 6 5 points Save Answer Which forecast method should you choose? MAD 4PT MA Exp Smoothing Trond (Linear Regression) QUESTION 7 Why choose this forecast method? Because the forecast is highest. O Because the MAD and the MSE is highest. O Because the MAD and the MSE is lowest O None of the above. QUESTION 8 What does the R^2 tell you about the quality of your forecast? There is a weak association and my forecast is not reliable. There is very strong association and my forecast is very reliable. O There is no association and my forecast is not reliable. O It doesn't tell me anything about the quality. UNIT 3 - Practice Problem 3.7 Government Data Summary Problem The following data describes the average number of unemployed workers ago 16 and over who have been unemployed for more than 27 weeks. The data comes from http://bis dat.gov, It describes rates from Jan 2019 to Dec 2019, Jan 2019 1878 Feb 2019 2041 Mar 2019 2275 Apr 2019 2207 May 2019 2591 Jun 2019 2647 Jul 2019 2917 Aug 2019 3182 Sep 2019 3680 Oct 2019 1948 Nov 2019 4381 Dee 2019 4965

Step by Step Solution

There are 3 Steps involved in it

1 Expert Approved Answer
Step: 1 Unlock blur-text-image
Question Has Been Solved by an Expert!

Get step-by-step solutions from verified subject matter experts

Step: 2 Unlock
Step: 3 Unlock

Students Have Also Explored These Related General Management Questions!