

Question: please answer every question! Thank you! begin{tabular}{cccc} hline SampleSize,n & MeanFactor,A2 & UpperRange,D4 & LowerRange,D3 hline 2 & 1.880 & 3.268 & 0
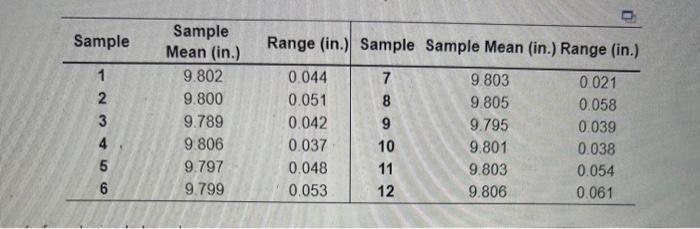
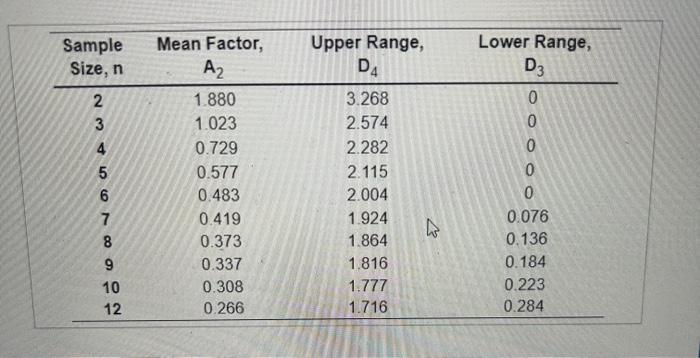
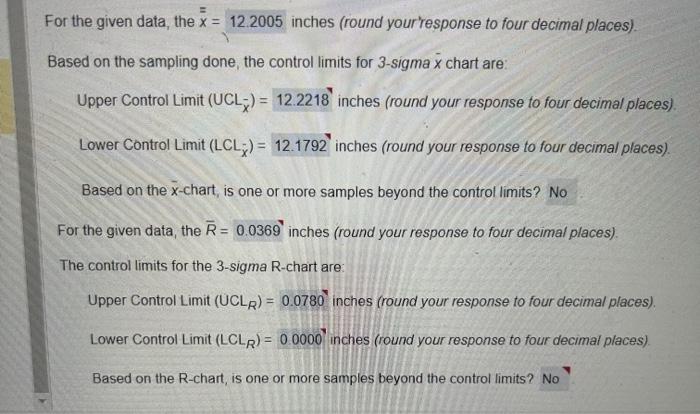
\begin{tabular}{cccc} \hline SampleSize,n & MeanFactor,A2 & UpperRange,D4 & LowerRange,D3 \\ \hline 2 & 1.880 & 3.268 & 0 \\ 3 & 1.023 & 2.574 & 0 \\ 4 & 0.729 & 2.282 & 0 \\ 5 & 0.577 & 2.115 & 0 \\ 6 & 0.483 & 2.004 & 0 \\ 7 & 0.419 & 1.924 & 0.076 \\ 8 & 0.373 & 1.864 & 0.136 \\ 9 & 0.337 & 1.816 & 0.184 \\ 10 & 0.308 & 1.777 & 0.223 \\ 12 & 0.266 & 1.716 & 0.284 \\ \hline \end{tabular} For the given data, the x=12.2005 inches (round your'response to four decimal places). Based on the sampling done, the control limits for 3 -sigma x chart are: Upper Control Limit (UCL)= inches (round your response to four decimal places). Lower Control Limit (LCL)= inches (round your response to four decimal places). Based on the x-chart, is one or more samples beyond the control limits? No For the given data, the R= inches (round your response to four decimal places). The control limits for the 3-sigma R-chart are: Upper Control Limit (UCLR)=0.0780 inches (round your response to four decimal places). Lower Control Limit (LCLR)=0.0000 inches (round your response to four decimal places). Based on the R-chart, is one or more samples beyond the control limits? \begin{tabular}{ccc|ccc} \hline Sample & SampleMean(in.) & Range (in.) & Sample & Sample Mean (in.) Range (in.) \\ \hline 1 & 9.802 & 0.044 & 7 & 9.803 & 0.021 \\ 2 & 9.800 & 0.051 & 8 & 9.805 & 0.058 \\ 3 & 9.789 & 0.042 & 9 & 9.795 & 0.039 \\ 4 & 9.806 & 0.037 & 10 & 9.801 & 0.038 \\ 5 & 9.797 & 0.048 & 11 & 9.803 & 0.054 \\ 6 & 9.799 & 0.053 & 12 & 9.806 & 0.061 \\ \hline \end{tabular} \begin{tabular}{cccc} \hline SampleSize,n & MeanFactor,A2 & UpperRange,D4 & LowerRange,D3 \\ \hline 2 & 1.880 & 3.268 & 0 \\ 3 & 1.023 & 2.574 & 0 \\ 4 & 0.729 & 2.282 & 0 \\ 5 & 0.577 & 2.115 & 0 \\ 6 & 0.483 & 2.004 & 0 \\ 7 & 0.419 & 1.924 & 0.076 \\ 8 & 0.373 & 1.864 & 0.136 \\ 9 & 0.337 & 1.816 & 0.184 \\ 10 & 0.308 & 1.777 & 0.223 \\ 12 & 0.266 & 1.716 & 0.284 \\ \hline \end{tabular} For the given data, the x=12.2005 inches (round your'response to four decimal places). Based on the sampling done, the control limits for 3 -sigma x chart are: Upper Control Limit (UCL)= inches (round your response to four decimal places). Lower Control Limit (LCL)= inches (round your response to four decimal places). Based on the x-chart, is one or more samples beyond the control limits? No For the given data, the R= inches (round your response to four decimal places). The control limits for the 3-sigma R-chart are: Upper Control Limit (UCLR)=0.0780 inches (round your response to four decimal places). Lower Control Limit (LCLR)=0.0000 inches (round your response to four decimal places). Based on the R-chart, is one or more samples beyond the control limits? \begin{tabular}{ccc|ccc} \hline Sample & SampleMean(in.) & Range (in.) & Sample & Sample Mean (in.) Range (in.) \\ \hline 1 & 9.802 & 0.044 & 7 & 9.803 & 0.021 \\ 2 & 9.800 & 0.051 & 8 & 9.805 & 0.058 \\ 3 & 9.789 & 0.042 & 9 & 9.795 & 0.039 \\ 4 & 9.806 & 0.037 & 10 & 9.801 & 0.038 \\ 5 & 9.797 & 0.048 & 11 & 9.803 & 0.054 \\ 6 & 9.799 & 0.053 & 12 & 9.806 & 0.061 \\ \hline \end{tabular}
Step by Step Solution
There are 3 Steps involved in it

Get step-by-step solutions from verified subject matter experts