

Question: please Answer everything do give all the calculation be clear and precise do the chart please if you dont see or understand something tell me
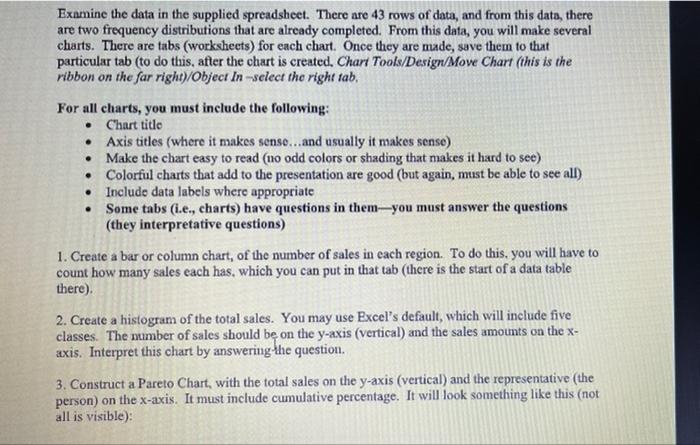
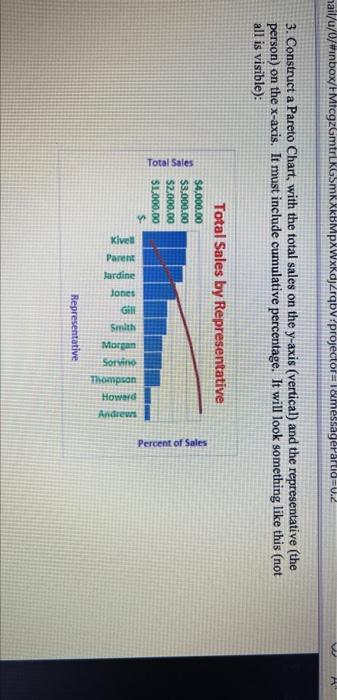
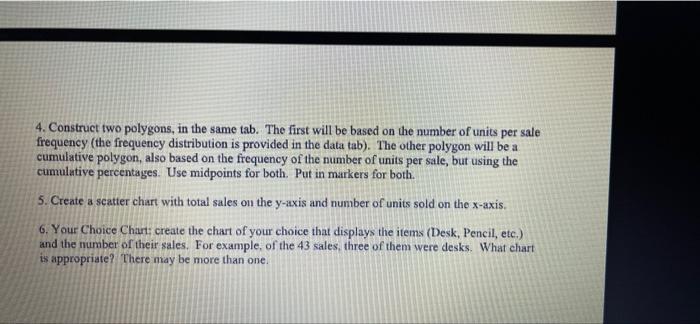
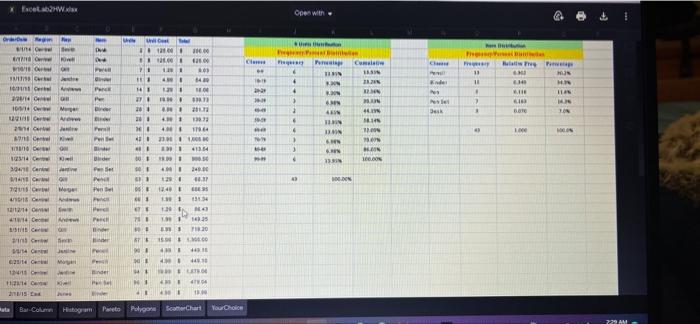
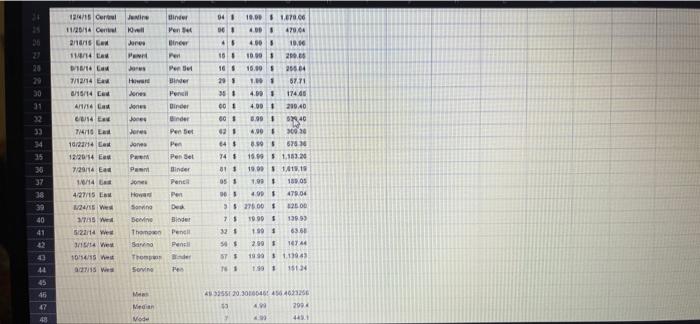
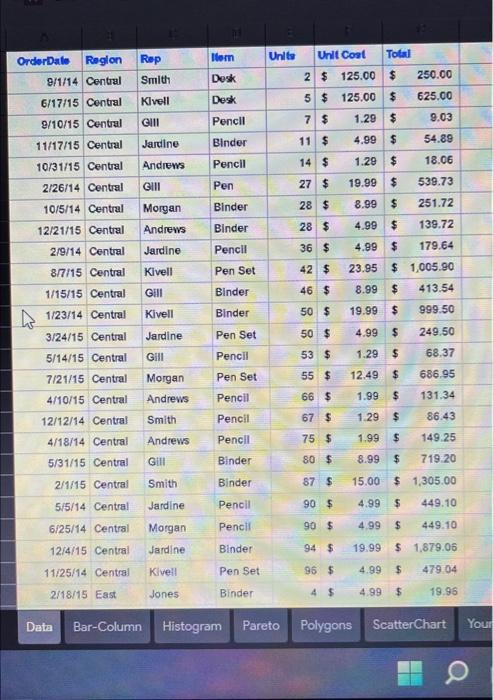
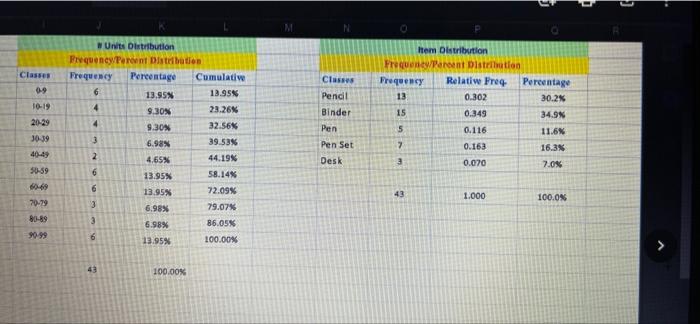

Examine the data in the supplied spreadsheet. There are 43 rows of data, and from this data, there are two frequency distributions that are already completed. From this data, you will make several charts. There are tabs (worksheets) for each chart. Once they are made, save them to that particular tab (to do this, after the chart is created. Chart Tools/Design/Move Chart (this is the ribbon on the far right)/Object in select the right tab, For all charts, you must include the following: Chart title Axis titles (where it makes sense...and usually it makes sense) Make the chart easy to read (110 odd colors or shading that makes it hard to see) Colorful charts that add to the presentation are good (but again, must be able to see all) Include data labels where appropriate Some tabs (i.e., charts) have questions in them-you must answer the questions (they interpretative questions) 1. Create a bar or column chart, of the number of sales in cach region. To do this, you will have to count how many sales each has, which you can put in that tab (there is the start of a data table there) 2. Create a histogram of the total sales. You may use Excel's default, which will include five classes. The number of sales should be on the y-axis (vertical) and the sales amounts on the x- axis. Interpret this chart by answering the question. 3. Construct a Pareto Chart, with the total sales on the y-axis (vertical) and the representative (the person) on the x-axis. It must include cumulative percentage. It will look something like this (not all is visible): mail/u/0/#inbox/FMtcgzGmtrRoSmkXkBMpXWxkdj2rqbV/projector TomessagePatlid=0.2 VA 3. Construct a Pareto Chart, with the total sales on the y-axis (vertical) and the representative (the person) on the x-axis. It must include cumulative percentage. It will look something like this (not all is visible): Total Sales by Representative Total Sales $4,000.00 $3,000.00 $2.000.00 SL000.00 $ Percent of Sales kivet Parent Jardine Jones GER Smith Morgan Sorino Thompson Howard Andrews Representative 4. Construct two polygons, in the same tab. The first will be based on the number of units per sale frequency (the frequency distribution is provided in the data tab). The other polygon will be a cumulative polygon, also based on the frequency of the number of units per sale, but using the cumulative percentages. Use midpoints for both. Put in markers for both. 5. Create a scatter chart with total sales on the y-axis and number of units sold on the x-axis. 6. Your Choice Chart: create the chart of your choice displays the items (Desk, Pencil, etc.) and the number of their sales. For example, of the 43 sales, three of them were desks. What chart is appropriate? There may be more than one. * Fagan do sau Open with Gm winder 1. . 1 Cie negara Cat C we . NEL M Than Home 13 11 . TO w en cur NE # . E NO PE Per 11 MODE 4 > 14 1 20 20. 2.1 20 41 911 6 GEN NES M 3 WE 101 Care 201 arom 9 NE 4 #H I BAN SN ON O . ! 1 4 0 NES NEE 100LON Per 24 OD 14 Can Car CM 18 ! . MON 19 1 1316 MOHLI ET MI 11025 1 7.30 STE 990 1981 4114 Car Crew 2014 24 CM 18 4 01 441 1 GI uta Bar.Com Histogram Peto Pedro Scala Your Chic 729 AM 04 . 10.00 $ 170.00 06 47004 36 2 20 20 30 31 18 100 16 201 19 Certet 11/20/14 Cel 2/10115 CM 114 LA 10/10 7/12/14 6/16/14 Led A1/C & Ea 74716 L 10/2013 Les 12/2014 En 7/29/14 E 38 ! 100 4900 10.16 10.900 209.06 15.00 20504 1. 67.71 4.00 1 174.05 4.00 210.40 3.99 1 6.90 3000 8.995 67830 15.99 1.18.20 19.01 141.18 1991 139.05 601 OP June tinder 10 Pen Jones Bine Punt Pei Pere Hr Bin Jones Per Jones Dinder Jones Binder Jones Pentet Jones Per Par Pensel Pem Binder Jones Penca Howard Pen Sonia sovine Bioder Thomas Pet Sand Pencil Thomas der Sorin Pee CC 35 30 37 64 $ 74 5 811 1/6/14 05 1 38 4.27715 E 101 100 400 4704 39 40 41 1 0605 24/15 W TAS We 52114 we 31514 View 104/15 2 $ 276.00 2000 75 1395 63.60 5$ 2001 174 ST 1999 313063 11 1931 15134 E SIDE 45 9 M O 9 40325520.30100464564636 2004 27 Medan CE 3 Vode 4 Torn Units Unli Cost Total Order Date Region 9/1/14 Central Rep Smith Desk 2 $ 125.00 $ 250.00 625.00 6/17/15 Central Kivell Desk 5 $ 125.00 $ GIII Pencil 7 $ 1.29 $ 9.03 9/10/15 Central 11/17/15 Central Binder 11 $ 4.99 $ 54.89 Jardine Andrews Pencil 14 $ 18.06 10/31/15 Central 2/26/14 Central GIII Pen 27 $ 1.29 $ 19.99 $ 8.99 $ 539.73 10/5/14 Central 28 $ 251.72 Morgan Andrews Jardine Binder Binder 12/21/15 Central 28 $ 4.99 $ 139.72 2/9/14 Central 36 $ 179.64 4.99 $ Pencil Pen Set 8/7/15 Central Kivell 42 $ 23.95 $ 1,005,90 GHII Binder 46 $ 8.99 $ 413.54 1/15/15 Central 1/23/14 Central Kivell Binder 50 $ 19.99 $ 999.50 3/24/15 Central Jardine Pen Set 50 $ 4.99 $ 249.50 Pencil 53 $ 1.29 $ 68.37 5/14/15 Central 7/21/15 Central 55 $ 12.49 $ 686.95 4/10/15 Central GINI Morgan Andrews Smith Andrews 66 $ 1.99 $ 131.34 Pen Set Pencil Pencil Pencil 12/12/14 Central 67 $ 86.43 1.29 $ 4/18/14 Central 75 $ 1.99 $ 149.25 5/31/15 Central GHII Binder 80 $ 8.99 $ 719:20 2/1/15 Central Smith Binder 87 $ $ 1,305.00 15.00 4.99 5/5/14 Central Jardine Pencil 90 $ $ 449.10 6/25/14 Central Pencil 90 $ 4.99 $ 449.10 Morgan Jardine 12/4/15 Central Binder 94 $ 19.99 $ 1,879.06 11/25/14 Central Kivell Pen Set 96 $ 4.99 $ 479.04 2/18/15 East Jones Binder 4 $ 4.99 $ 19.96 Data Bar-Column Histogram Pareto Polygons ScatterChart Your Classes 09 10-19 20-29 Units Distribution Frequency Perent Distribution Frequency Percentage Cumulative 6 13.95% 13.95% 4 9.30N 23.26% 4 9.30 32.56% 3 6.98% 39.53% 2 4,65% 44.19% 6 13.95% 58.14% 6 13.95% 72.09% 3 6.989 79.07% 3 6.98% 86.05% 6 13.95% 100.00% Classes Pencil Binder Pen Pen Set Desk Item Distribution Frequent Parent Distribution Frequency Relatiwe Free Pereantage 13 0.302 30.2% 15 0.349 34.9% 5 0.116 11.6% 0.163 16.3% 3 0.070 7.0% 30-39 50-59 60-69 43 1.000 70-79 100.0% 80-89 $0.99 49 100.00% 11/8/14 East Parent Pen 15 $ 19.99 $ 299.85 9/18/14 East Jones Pen Set 16 $ 15.99 $ 255.84 7/12/14 East Howard Binder 29 $ 1.99 $ 57.71 8/15/14 East Jones Pencil 35 $ 4.99 $ 174.65 4/1/14 East Jones Binder 60 $ 4.99 $ 299.40 6/8/14 East Jones Binder 60 $ 8.99 $ 539,40 7/4/15 East Jones 62 $ 4.99 $ 309.38 Pen Set Pen 10/22/14 East Jones 64 $ 8.99 $ 575.36 12/29/14 East Parent Pen Set 74 $ 15.99 $ 1,183.26 7/29/14 East Parent Binder 81 $ 19.99 $ 1,619.19 1/6/14 East Pencil 95 $ 1.99 $ 189.05 Jones Howard 4/27/15 East Pen 96 $ 4.99 $ 479.04 8/24/15 West Sorvino Desk 3 $ 275.00 $ 825.00 3/7/15 West Sorvino Binder 7 $ 19.99 $ 139.93 5/22/14 West Pencil 32 $ 1.99 $ 63.68 3/15/14 West Pencil 56 $ 2.99 $ 167.44 Thompson Sorvino Thompson Sorvino Binder 57 $ 19.99 $ 1.139.43 10/14/15 West 9/27/15 West Pen 76 $ 1.99 $ 151.24 Mean ho Median Mode 49.3255 20.30860465 456 4623256 53 4.99 299,4 7 4.99 4491 Data Bar-Column Histogram Pareto Polygons ScatterChart YourChoice Examine the data in the supplied spreadsheet. There are 43 rows of data, and from this data, there are two frequency distributions that are already completed. From this data, you will make several charts. There are tabs (worksheets) for each chart. Once they are made, save them to that particular tab (to do this, after the chart is created. Chart Tools/Design/Move Chart (this is the ribbon on the far right)/Object in select the right tab, For all charts, you must include the following: Chart title Axis titles (where it makes sense...and usually it makes sense) Make the chart easy to read (110 odd colors or shading that makes it hard to see) Colorful charts that add to the presentation are good (but again, must be able to see all) Include data labels where appropriate Some tabs (i.e., charts) have questions in them-you must answer the questions (they interpretative questions) 1. Create a bar or column chart, of the number of sales in cach region. To do this, you will have to count how many sales each has, which you can put in that tab (there is the start of a data table there) 2. Create a histogram of the total sales. You may use Excel's default, which will include five classes. The number of sales should be on the y-axis (vertical) and the sales amounts on the x- axis. Interpret this chart by answering the question. 3. Construct a Pareto Chart, with the total sales on the y-axis (vertical) and the representative (the person) on the x-axis. It must include cumulative percentage. It will look something like this (not all is visible): mail/u/0/#inbox/FMtcgzGmtrRoSmkXkBMpXWxkdj2rqbV/projector TomessagePatlid=0.2 VA 3. Construct a Pareto Chart, with the total sales on the y-axis (vertical) and the representative (the person) on the x-axis. It must include cumulative percentage. It will look something like this (not all is visible): Total Sales by Representative Total Sales $4,000.00 $3,000.00 $2.000.00 SL000.00 $ Percent of Sales kivet Parent Jardine Jones GER Smith Morgan Sorino Thompson Howard Andrews Representative 4. Construct two polygons, in the same tab. The first will be based on the number of units per sale frequency (the frequency distribution is provided in the data tab). The other polygon will be a cumulative polygon, also based on the frequency of the number of units per sale, but using the cumulative percentages. Use midpoints for both. Put in markers for both. 5. Create a scatter chart with total sales on the y-axis and number of units sold on the x-axis. 6. Your Choice Chart: create the chart of your choice displays the items (Desk, Pencil, etc.) and the number of their sales. For example, of the 43 sales, three of them were desks. What chart is appropriate? There may be more than one. * Fagan do sau Open with Gm winder 1. . 1 Cie negara Cat C we . NEL M Than Home 13 11 . TO w en cur NE # . E NO PE Per 11 MODE 4 > 14 1 20 20. 2.1 20 41 911 6 GEN NES M 3 WE 101 Care 201 arom 9 NE 4 #H I BAN SN ON O . ! 1 4 0 NES NEE 100LON Per 24 OD 14 Can Car CM 18 ! . MON 19 1 1316 MOHLI ET MI 11025 1 7.30 STE 990 1981 4114 Car Crew 2014 24 CM 18 4 01 441 1 GI uta Bar.Com Histogram Peto Pedro Scala Your Chic 729 AM 04 . 10.00 $ 170.00 06 47004 36 2 20 20 30 31 18 100 16 201 19 Certet 11/20/14 Cel 2/10115 CM 114 LA 10/10 7/12/14 6/16/14 Led A1/C & Ea 74716 L 10/2013 Les 12/2014 En 7/29/14 E 38 ! 100 4900 10.16 10.900 209.06 15.00 20504 1. 67.71 4.00 1 174.05 4.00 210.40 3.99 1 6.90 3000 8.995 67830 15.99 1.18.20 19.01 141.18 1991 139.05 601 OP June tinder 10 Pen Jones Bine Punt Pei Pere Hr Bin Jones Per Jones Dinder Jones Binder Jones Pentet Jones Per Par Pensel Pem Binder Jones Penca Howard Pen Sonia sovine Bioder Thomas Pet Sand Pencil Thomas der Sorin Pee CC 35 30 37 64 $ 74 5 811 1/6/14 05 1 38 4.27715 E 101 100 400 4704 39 40 41 1 0605 24/15 W TAS We 52114 we 31514 View 104/15 2 $ 276.00 2000 75 1395 63.60 5$ 2001 174 ST 1999 313063 11 1931 15134 E SIDE 45 9 M O 9 40325520.30100464564636 2004 27 Medan CE 3 Vode 4 Torn Units Unli Cost Total Order Date Region 9/1/14 Central Rep Smith Desk 2 $ 125.00 $ 250.00 625.00 6/17/15 Central Kivell Desk 5 $ 125.00 $ GIII Pencil 7 $ 1.29 $ 9.03 9/10/15 Central 11/17/15 Central Binder 11 $ 4.99 $ 54.89 Jardine Andrews Pencil 14 $ 18.06 10/31/15 Central 2/26/14 Central GIII Pen 27 $ 1.29 $ 19.99 $ 8.99 $ 539.73 10/5/14 Central 28 $ 251.72 Morgan Andrews Jardine Binder Binder 12/21/15 Central 28 $ 4.99 $ 139.72 2/9/14 Central 36 $ 179.64 4.99 $ Pencil Pen Set 8/7/15 Central Kivell 42 $ 23.95 $ 1,005,90 GHII Binder 46 $ 8.99 $ 413.54 1/15/15 Central 1/23/14 Central Kivell Binder 50 $ 19.99 $ 999.50 3/24/15 Central Jardine Pen Set 50 $ 4.99 $ 249.50 Pencil 53 $ 1.29 $ 68.37 5/14/15 Central 7/21/15 Central 55 $ 12.49 $ 686.95 4/10/15 Central GINI Morgan Andrews Smith Andrews 66 $ 1.99 $ 131.34 Pen Set Pencil Pencil Pencil 12/12/14 Central 67 $ 86.43 1.29 $ 4/18/14 Central 75 $ 1.99 $ 149.25 5/31/15 Central GHII Binder 80 $ 8.99 $ 719:20 2/1/15 Central Smith Binder 87 $ $ 1,305.00 15.00 4.99 5/5/14 Central Jardine Pencil 90 $ $ 449.10 6/25/14 Central Pencil 90 $ 4.99 $ 449.10 Morgan Jardine 12/4/15 Central Binder 94 $ 19.99 $ 1,879.06 11/25/14 Central Kivell Pen Set 96 $ 4.99 $ 479.04 2/18/15 East Jones Binder 4 $ 4.99 $ 19.96 Data Bar-Column Histogram Pareto Polygons ScatterChart Your Classes 09 10-19 20-29 Units Distribution Frequency Perent Distribution Frequency Percentage Cumulative 6 13.95% 13.95% 4 9.30N 23.26% 4 9.30 32.56% 3 6.98% 39.53% 2 4,65% 44.19% 6 13.95% 58.14% 6 13.95% 72.09% 3 6.989 79.07% 3 6.98% 86.05% 6 13.95% 100.00% Classes Pencil Binder Pen Pen Set Desk Item Distribution Frequent Parent Distribution Frequency Relatiwe Free Pereantage 13 0.302 30.2% 15 0.349 34.9% 5 0.116 11.6% 0.163 16.3% 3 0.070 7.0% 30-39 50-59 60-69 43 1.000 70-79 100.0% 80-89 $0.99 49 100.00% 11/8/14 East Parent Pen 15 $ 19.99 $ 299.85 9/18/14 East Jones Pen Set 16 $ 15.99 $ 255.84 7/12/14 East Howard Binder 29 $ 1.99 $ 57.71 8/15/14 East Jones Pencil 35 $ 4.99 $ 174.65 4/1/14 East Jones Binder 60 $ 4.99 $ 299.40 6/8/14 East Jones Binder 60 $ 8.99 $ 539,40 7/4/15 East Jones 62 $ 4.99 $ 309.38 Pen Set Pen 10/22/14 East Jones 64 $ 8.99 $ 575.36 12/29/14 East Parent Pen Set 74 $ 15.99 $ 1,183.26 7/29/14 East Parent Binder 81 $ 19.99 $ 1,619.19 1/6/14 East Pencil 95 $ 1.99 $ 189.05 Jones Howard 4/27/15 East Pen 96 $ 4.99 $ 479.04 8/24/15 West Sorvino Desk 3 $ 275.00 $ 825.00 3/7/15 West Sorvino Binder 7 $ 19.99 $ 139.93 5/22/14 West Pencil 32 $ 1.99 $ 63.68 3/15/14 West Pencil 56 $ 2.99 $ 167.44 Thompson Sorvino Thompson Sorvino Binder 57 $ 19.99 $ 1.139.43 10/14/15 West 9/27/15 West Pen 76 $ 1.99 $ 151.24 Mean ho Median Mode 49.3255 20.30860465 456 4623256 53 4.99 299,4 7 4.99 4491 Data Bar-Column Histogram Pareto Polygons ScatterChart YourChoice
Step by Step Solution
There are 3 Steps involved in it

Get step-by-step solutions from verified subject matter experts