

Question: please answer everything Thirty samples of size 3 , available in the table below, were taken from a machining process over a 15-hour period. What
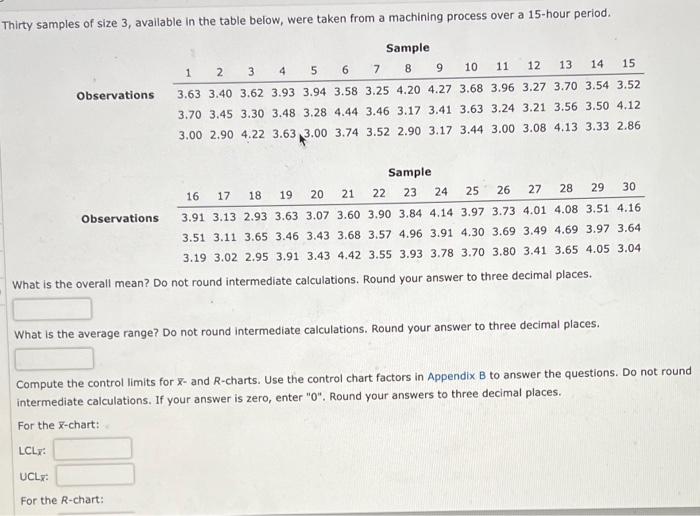
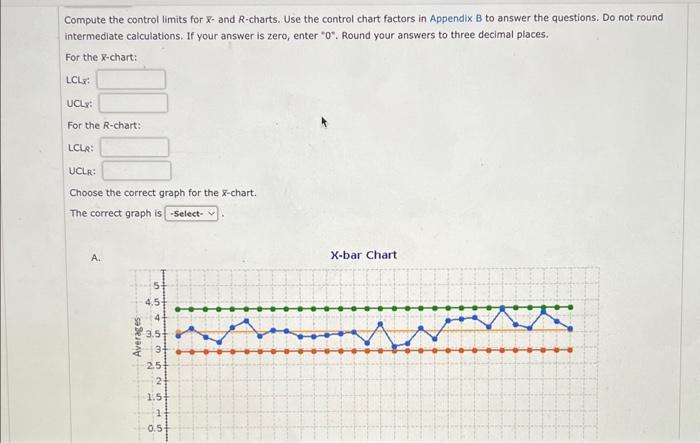
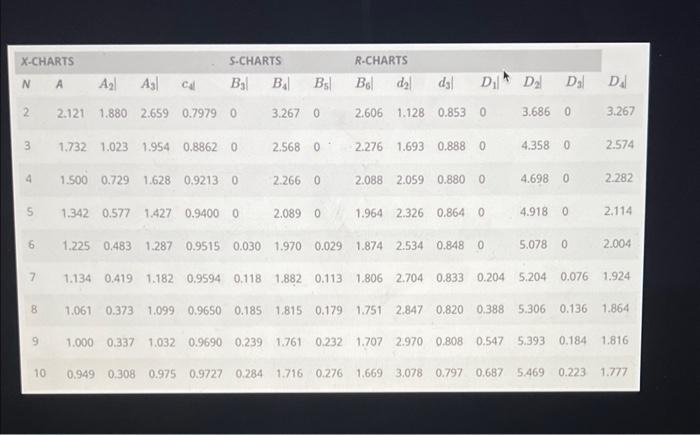
Thirty samples of size 3 , available in the table below, were taken from a machining process over a 15-hour period. What is the overall mean? Do not round intermediate calculations. Round your answer to three decimal places. What is the average range? Do not round intermediate calculations. Round your answer to three decimal places. Compute the control limits for x - and R-charts. Use the control chart factors in Appendix B to answer the questions. Do not round intermediate calculations. If your answer is zero, enter " 0 ". Round your answers to three decimal places. For the x-chart: LCLx: UCL: For the R-chart: Compute the control limits for x - and R-charts. Use the control chart factors in Appendix B to answer the questions. Do not round intermediate calculations. If your answer is zero, enter 0. Round your answers to three decimal places. For the X-chart: LCLs: UCL For the R-chart: LCLe: UCLR: Choose the correct graph for the x-chart. The correct graph is
Step by Step Solution
There are 3 Steps involved in it

Get step-by-step solutions from verified subject matter experts