

Question: Please answer explain how to do this in R Use R for all answers. A marketing manager studied annual product sales figures over a ten
Please answer explain how to do this in R
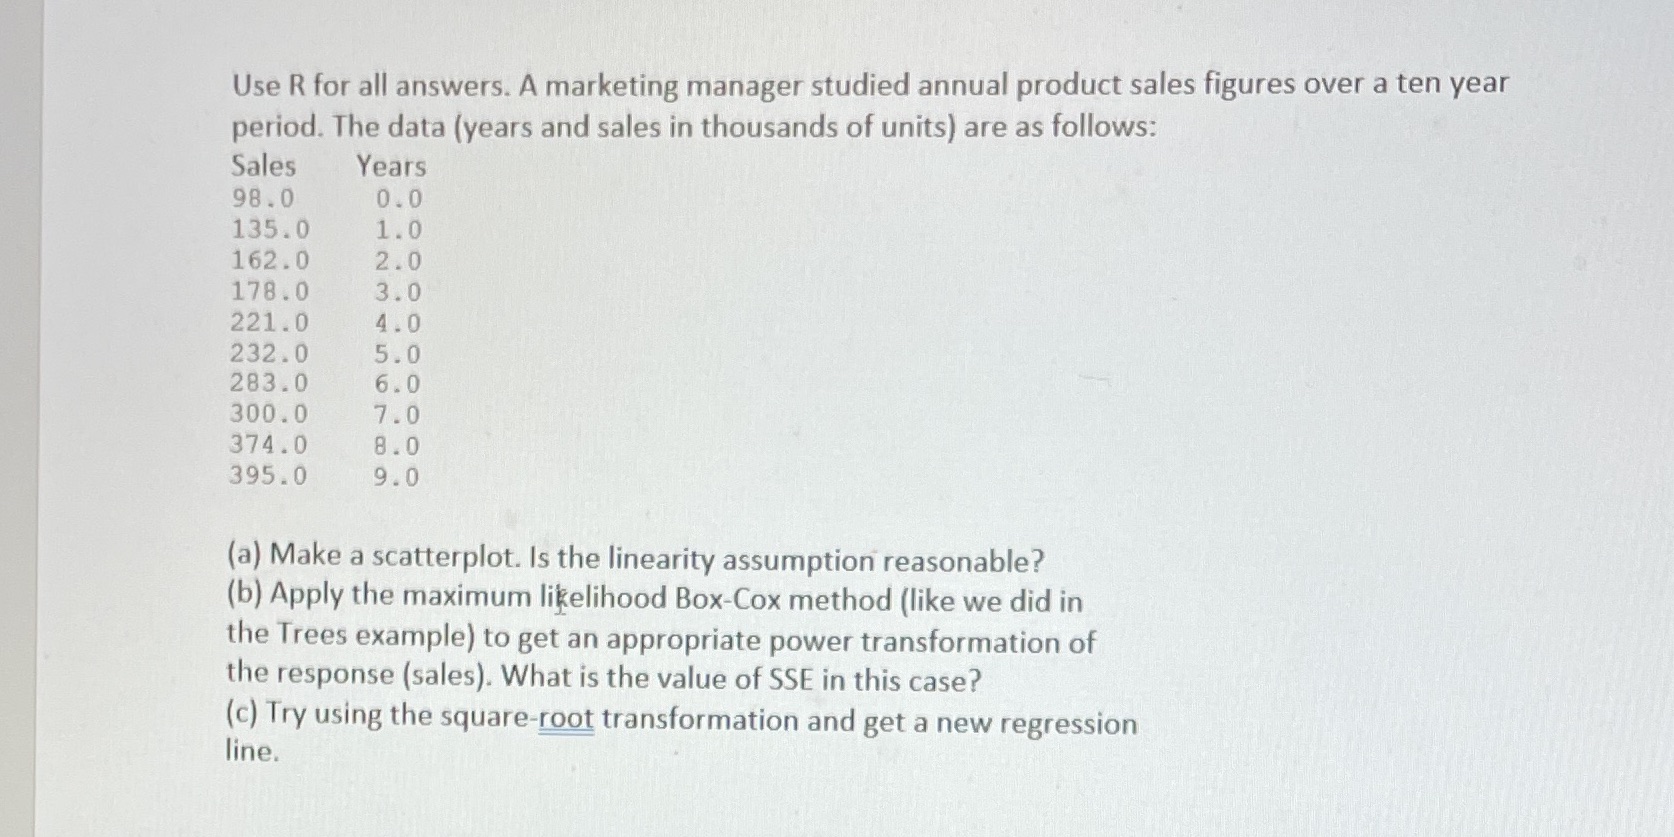
Use R for all answers. A marketing manager studied annual product sales figures over a ten year period. The data (years and sales in thousands of units) are as follows: Sales Years 98 . 0 0.0 135.0 1.0 162.0 2.0 178.0 3.0 221.0 4.0 232.0 5.0 283.0 6.0 300.0 7.0 374.0 8.0 395.0 9.0 (a) Make a scatterplot. Is the linearity assumption reasonable? (b) Apply the maximum likelihood Box-Cox method (like we did in the Trees example) to get an appropriate power transformation of the response (sales). What is the value of SSE in this case? (c) Try using the square-root transformation and get a new regression line
Step by Step Solution
There are 3 Steps involved in it

Get step-by-step solutions from verified subject matter experts