

Question: please answer following questions 1. The table on the right contains employment data for males and females between May 2020 and April 2021. The data
please answer following questions
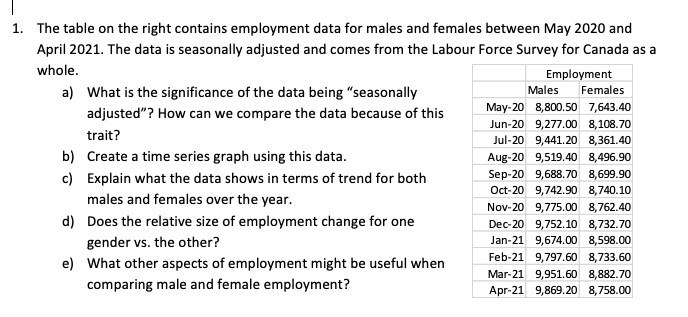
1. The table on the right contains employment data for males and females between May 2020 and April 2021. The data is seasonally adjusted and comes from the Labour Force Survey for Canada as a whole. Employment a) What is the significance of the data being "seasonally Males Females adjusted"? How can we compare the data because of this May-20 8,800.50 7,643.40 Jun-20 9,277.00 8,108.70 trait? Jul-20 9,441.20 8,361.40 b) Create a time series graph using this data. Aug-20 9,519.40 8,496.90 c) Explain what the data shows in terms of trend for both Sep-20 9,688.70 8,699.90 Oct-20 9,742.90 8,740.10 males and females over the year. Nov-20 9,775.00 8,762.40 d) Does the relative size of employment change for one Dec-20 9,752.10 8,732.70 gender vs. the other? Jan-21 9,674.00 8,598.00 e) What other aspects of employment might be useful when Feb-21 9,797.60 8,733.60 Mar-21 9,951.60 8,882.70 comparing male and female employment? Apr-21 9,869.20 8,758.00
Step by Step Solution
There are 3 Steps involved in it

Get step-by-step solutions from verified subject matter experts