

Question: Please answer. I need the test statistic and p-value please! QUESTION 10 . 1 POINT A market research firm is testing whether a new color
Please answer. I need the test statistic and p-value please!
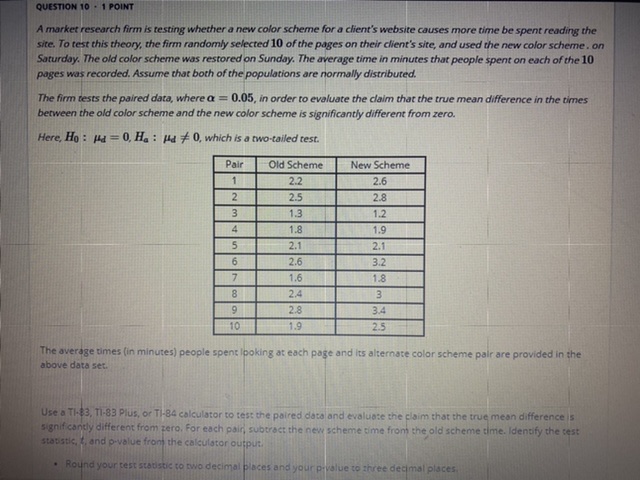
QUESTION 10 . 1 POINT A market research firm is testing whether a new color scheme for a client's website causes more time be spent reading the site. To test this theory, the firm randomly selected 10 of the pages on their client's site, and used the new color scheme . on Saturday. The old color scheme was restored on Sunday. The average time in minutes that people spent on each of the 10 pages was recorded. Assume that both of the populations are normally distributed. The firm tests the paired data, where a = 0.05, in order to evaluate the claim that the true mean difference in the times between the old color scheme and the new color scheme is significantly different from zero. Here, Ho : Ha = 0. He : Ha # 0, which is a two-tailed test. Pair Old Scheme New Scheme 1 2.2 2.6 2 2.5 2.8 3 1.3 1.2 4 1.8 1.9 5 2.1 2.1 6 2.6 3.2 1.6 1.8 8 2.4 3 9 2.8 3.4 10 1.9 2.5 The average times (in minutes) people spent looking at each page and its alternate color scheme pair are provided in the above data set. Use a TI-$3, TI-83 Plus, or TI-84 calculator to test the paired data and evaluate the claim that the true mean difference s significantly different from zero. For each pair subtract the new scheme time from the old scheme time. Identify the rest stabstic, , and p-value from the calculator output. Round your best statistic to two decimal places and your pavalue to shree decimal places
Step by Step Solution
There are 3 Steps involved in it

Get step-by-step solutions from verified subject matter experts