

Question: Please answer in an Excel File because that is the requirement. And please show all the work in an Excel file so all the formulas
Please answer in an Excel File because that is the requirement. And please show all the work in an Excel file so all the formulas used to get the answer NOT just the answer. Every piece of data must come from a formula to obtain the grade Thank you.
Question
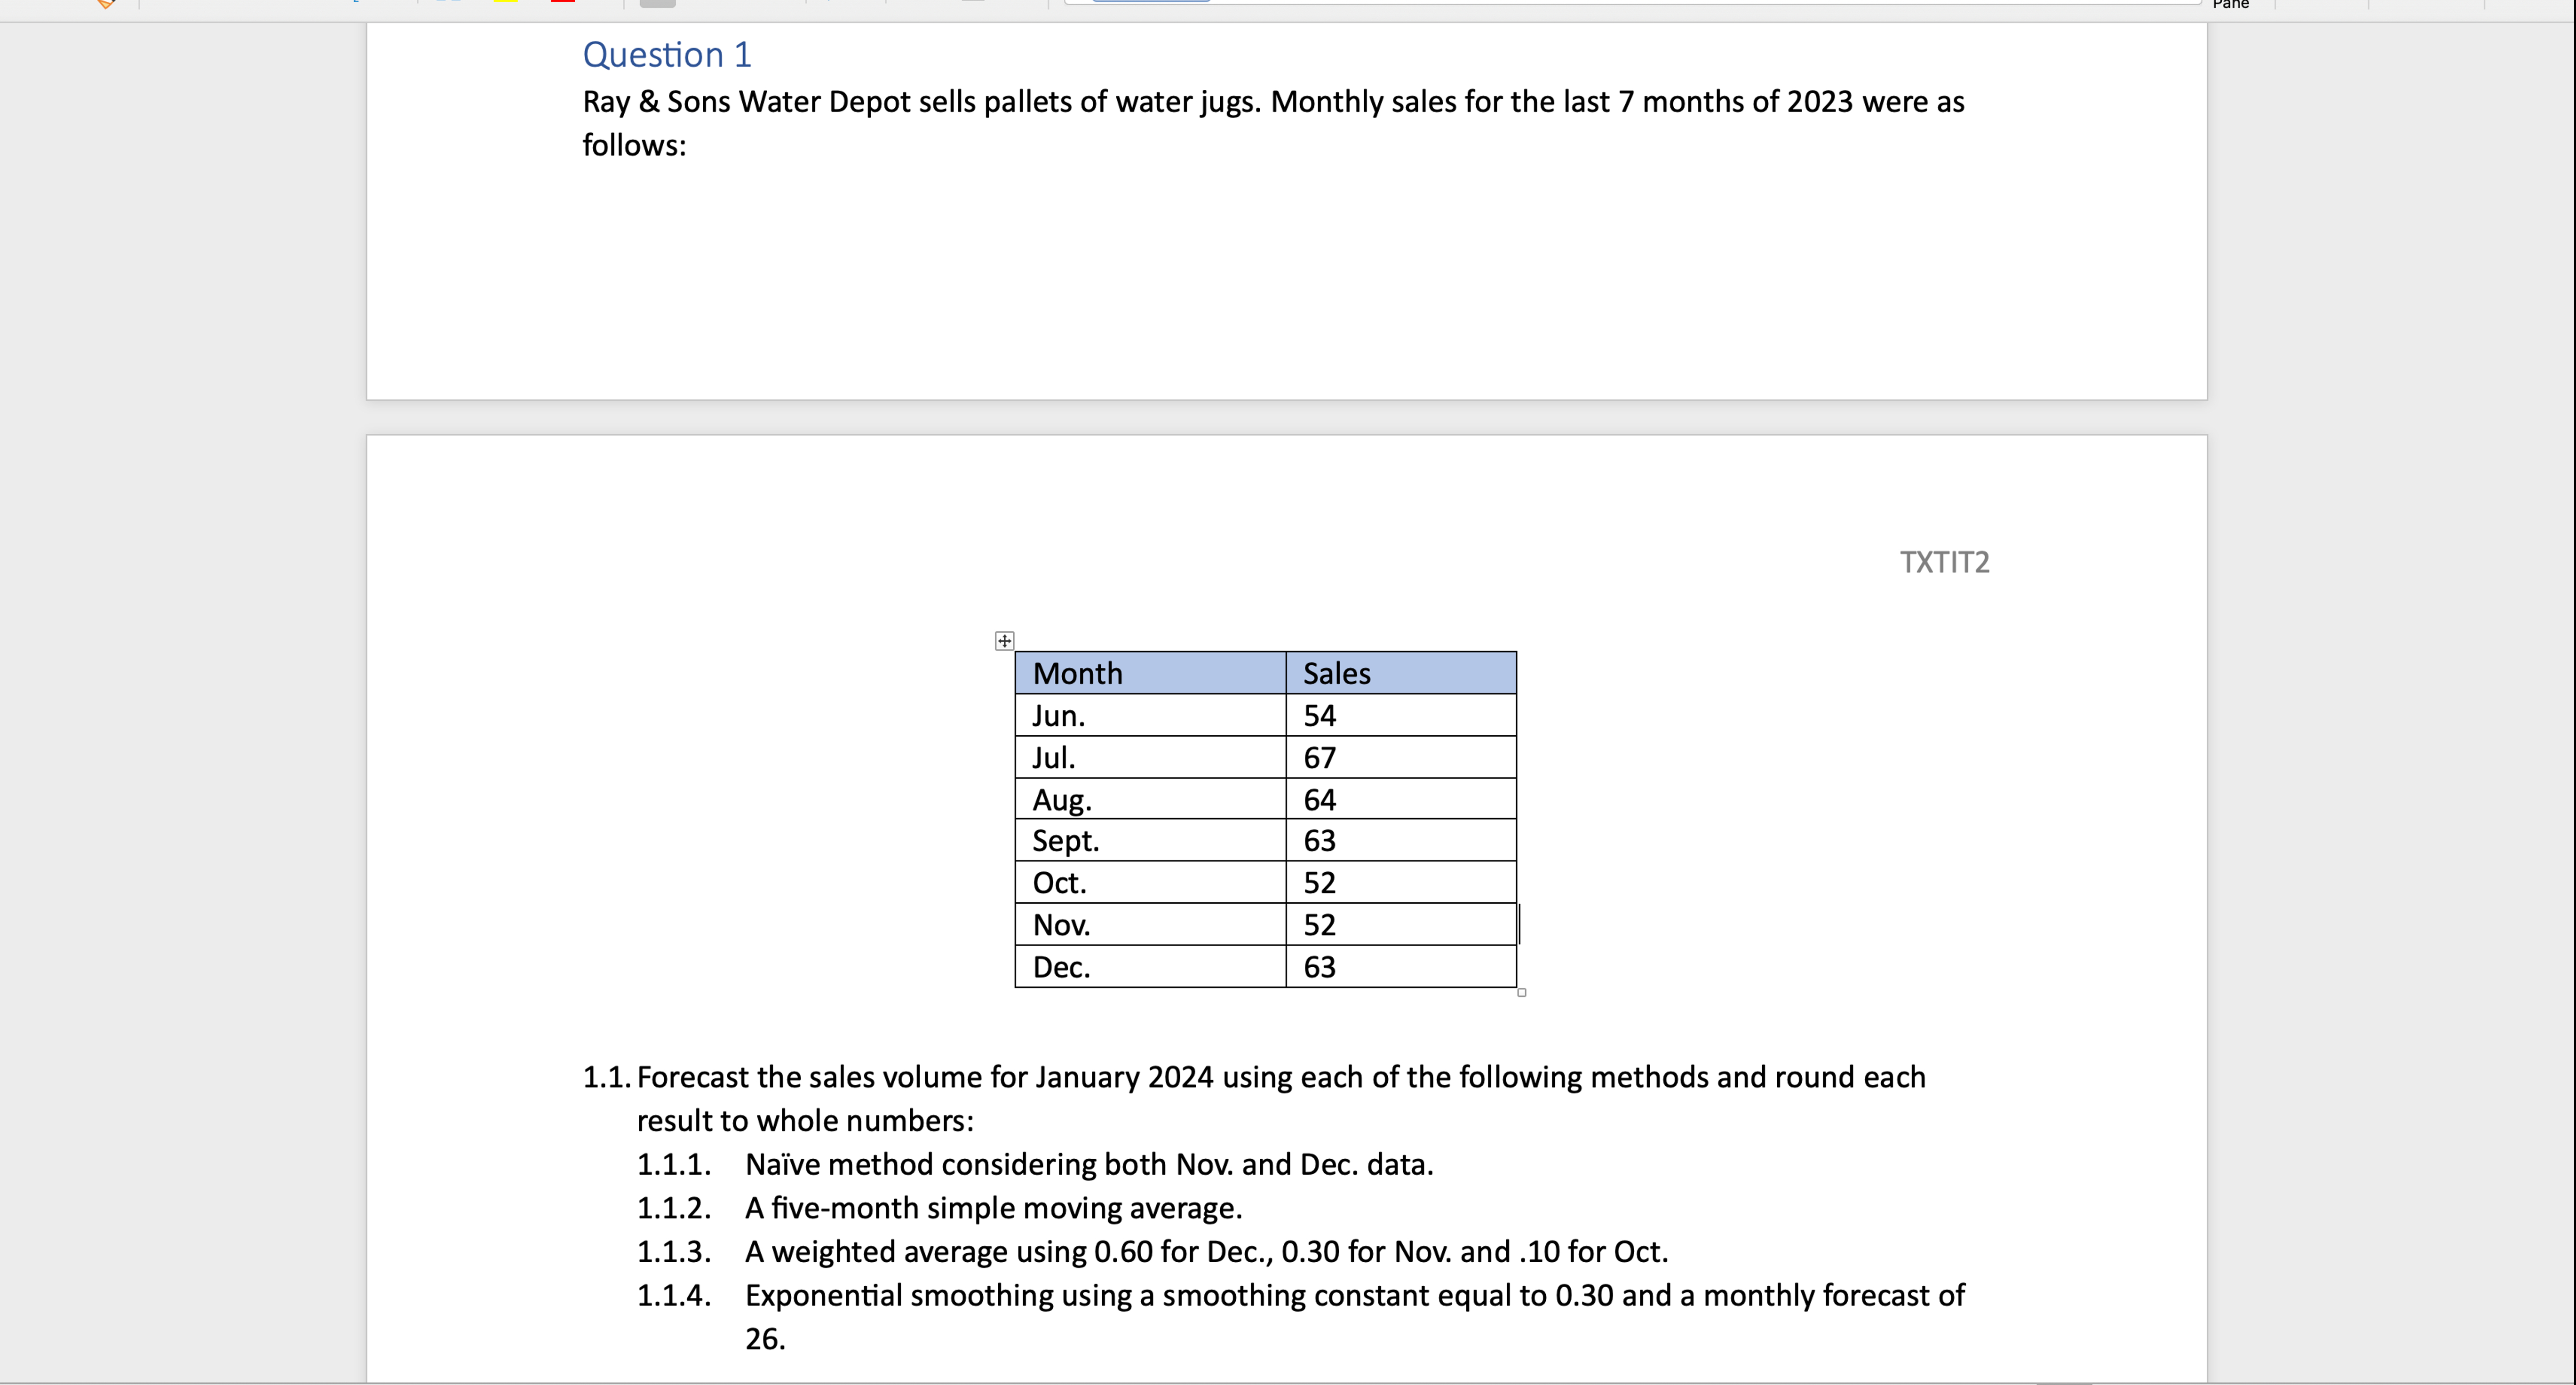
Ray & Sons Water Depot sells pallets of water jugs. Monthly sales for the last months of were as
follows:
Forecast the sales volume for January using each of the following methods and round each
result to whole numbers:
Nave method considering both Nov. and Dec. data.
A fivemonth simple moving average.
A weighted average using for Dec., for Nov. and for Oct.
Exponential smoothing using a smoothing constant equal to and a monthly forecast of
Question
A local traffic monitoring agency received data on speeding tickets for the past few months, as well as
two sets of forecasts made by their analysts. Analyzing this data is important to understand driver
behaviour. See table below.
Calculate the MAD for forecasts and Show value on decimal points.
Calculate the MSE for forecasts and Show value on decimal points.
Calculate the MAPE for forecasts and Show value on decimal points.
Based on your forecast error analyses, which of the two forecasts is the most accurate and why?
Question
As spring approaches, John and Mary need to forecast the number of guests they will have in their trailer park. John's estimate is that in the new year they will have guests. In addition, below is the number of guests they have had over the last years.
Month January February March April May June July August September October November December
Based on the data above, calculate the seasonal index for each month. Show results using decimal points.
Based on the data above and the seasonal index on question above, calculate the seasonal volume by month for the new fiscal year. Show results using whole numbers.
Identify operational decisions that may be impacted by this forecast.
Step by Step Solution
There are 3 Steps involved in it
1 Expert Approved Answer
Step: 1 Unlock

Question Has Been Solved by an Expert!
Get step-by-step solutions from verified subject matter experts
Step: 2 Unlock
Step: 3 Unlock