

Question: please answer in bold and use graph provided. Suppose that labor is the only input used by a perfectly competitive rm. The firm's production function
please answer in bold and use graph provided.
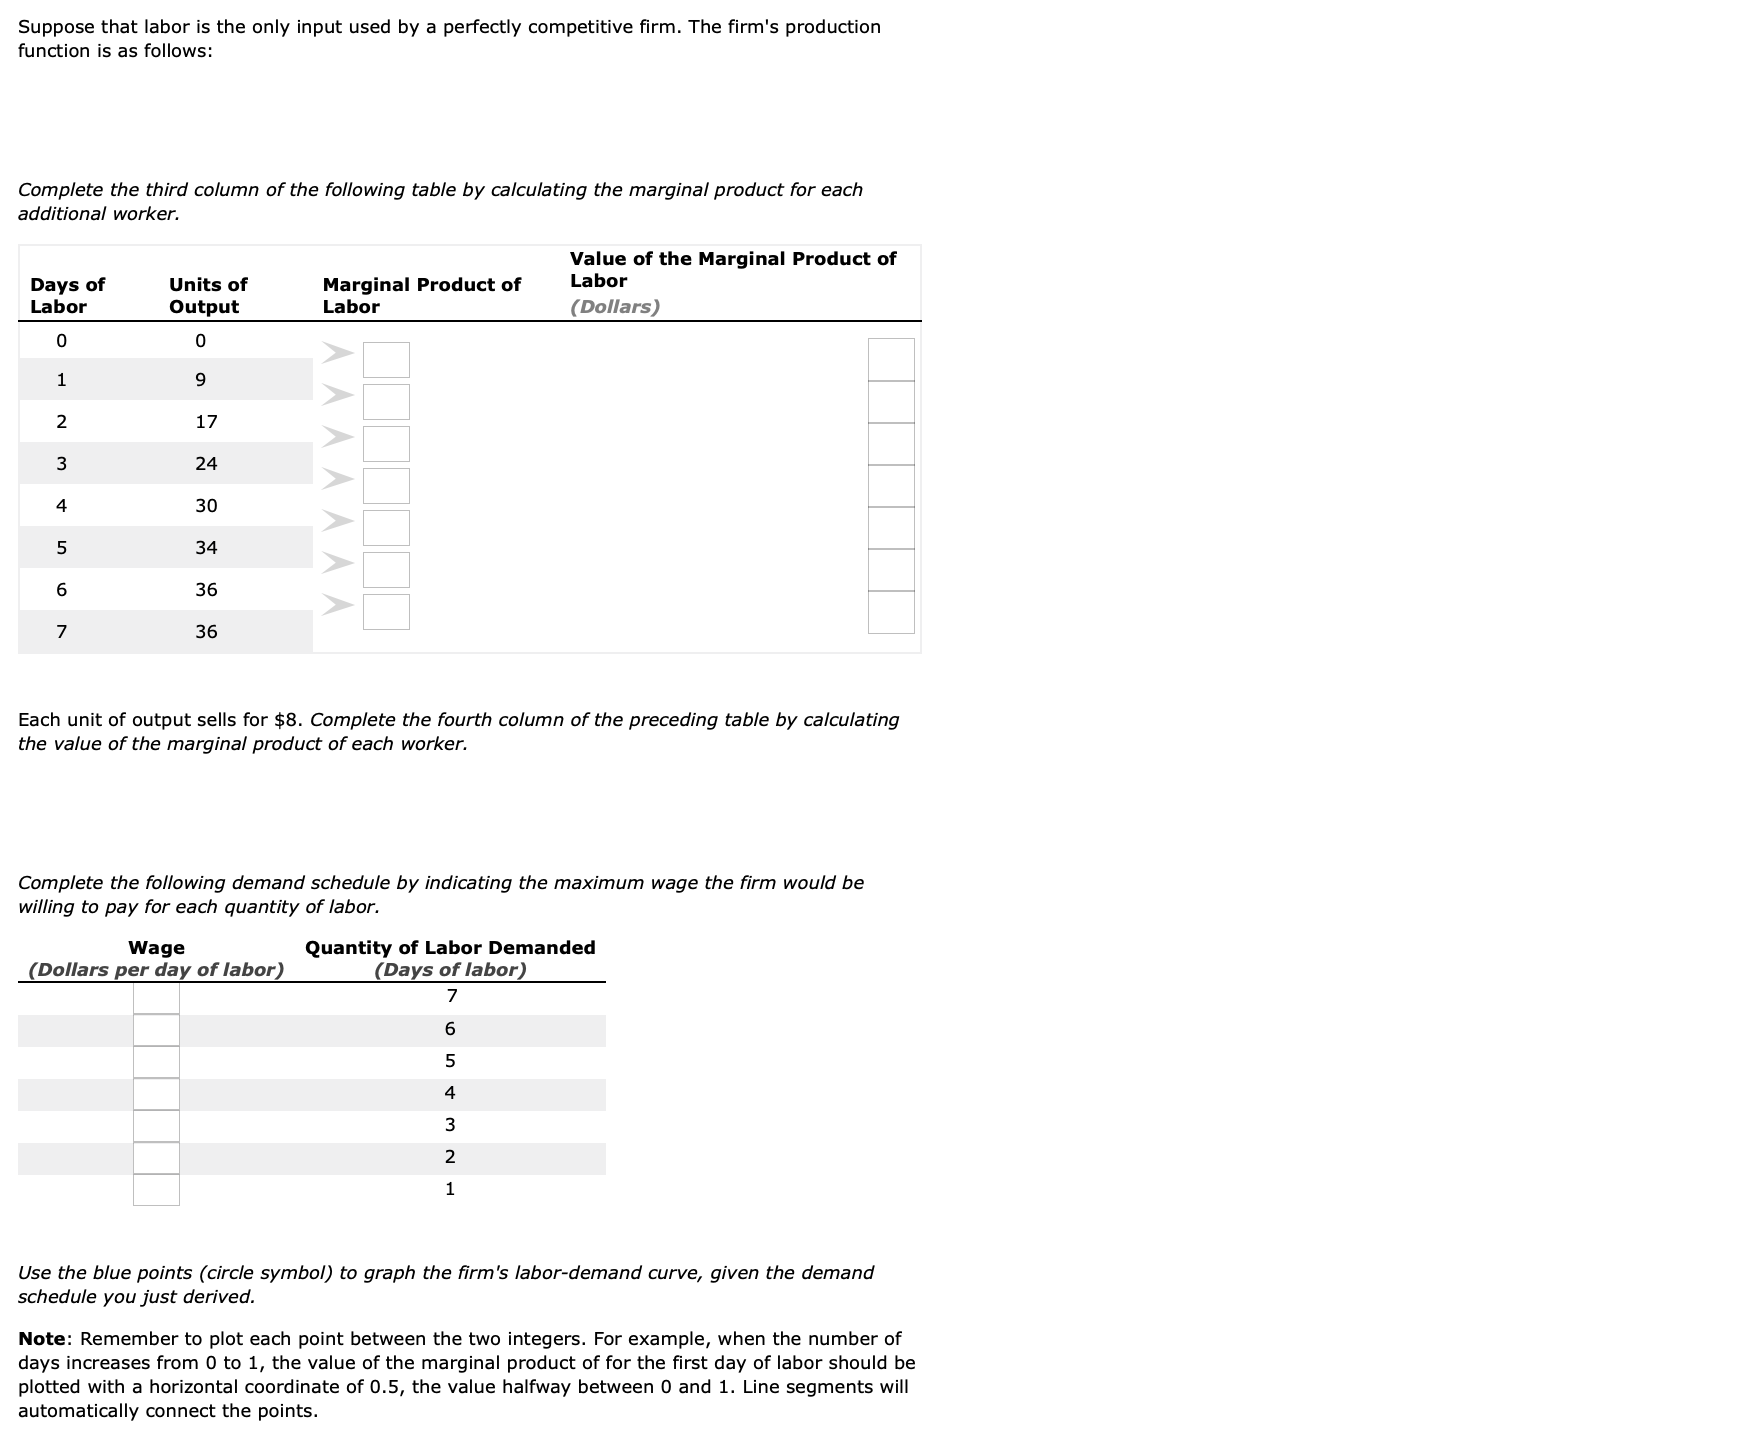
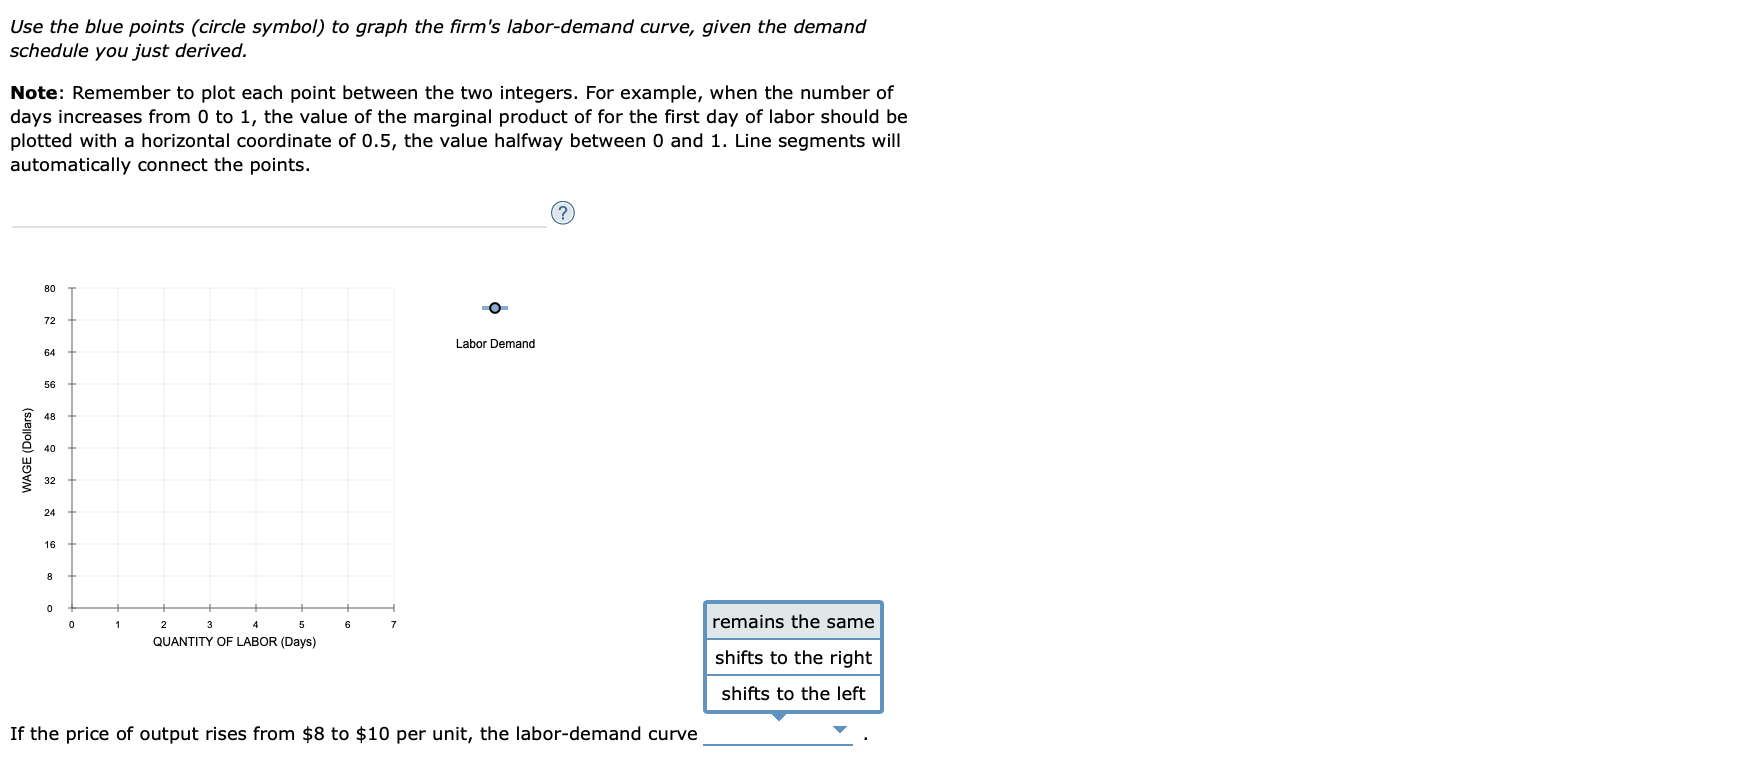
Suppose that labor is the only input used by a perfectly competitive rm. The firm's production function is as follows: Complete the third column of the following table by calculating the marginal product for each additional worker. Value of the Marginal Product of Days of Units of Marginal Product of Labor Labor Output Labor (Dollars) 0 0 1 9 _ Z 17 _ 3 24 _ 4 30 34 6 36 7 36 Each unit of output sells for $8. Complete the fourth column of the preceding table by calculating the value of the marginal product of each worker. Complete the following demand schedule by indicating the maximum wage the firm would be willing to pay for each quantity of labor. Wage Quantity of Labor Demanded (Dollars per day of labor) (Days of labor) 7 6 5 4 3 2 1 Use the blue points (circle symbol) to graph the rm's labor-demand curve, given the demand schedule you just derived. Note: Remember to plot each point between the two integers. For example, when the number of days increases from O to 1, the value of the marginal product of for the rst day of labor should be plotted with a horizontal coordinate of 0.5, the value halfway between D and 1. Line segments will automatically oonnect the points. Use the blue points (circle symbol) to graph the firm's labor-demand curve, given the demand schedule you just derived. Note: Remember to plot each point between the two integers. For example, when the number of days increases from 0 to 1, the value of the marginal product of for the first day of labor should be plotted with a horizontal coordinate of 0.5, the value halfway between 0 and 1. Line segments will automatically connect the points. 80 O 72 64 Labor Demand 56 WAGE (Dollars) 48 40 32 24 16 Co 3 remains the same QUANTITY OF LABOR (Days) shifts to the right shifts to the left If the price of output rises from $8 to $10 per unit, the labor-demand curve
Step by Step Solution
There are 3 Steps involved in it

Get step-by-step solutions from verified subject matter experts