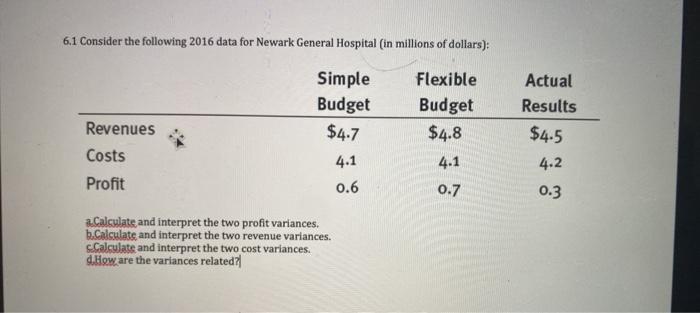
Question: please answer in chart 6.1 Consider the following 2016 data for Newark General Hospital (in millions of dollars): Simple Budget $4.7 4.1 0.6 Flexible Budget

please answer in chart
please answer in chart 6.1 Consider the following
6.1 Consider the following 2016 data for Newark General Hospital (in millions of dollars): Simple Budget $4.7 4.1 0.6 Flexible Budget $4.8 Revenues Costs Profit Actual Results $4.5 4.2 0.3 4.1 0.7 Calculate and interpret the two profit variances. b.Calculate and interpret the two revenue variances. s.Calculate and interpret the two cost variances. 4.How are the variances related

Step by Step Solution

There are 3 Steps involved in it

1 Expert Approved Answer
Step: 1 Unlock blur-text-image
Question Has Been Solved by an Expert!

Get step-by-step solutions from verified subject matter experts

Step: 2 Unlock
Step: 3 Unlock

Students Have Also Explored These Related General Management Questions!