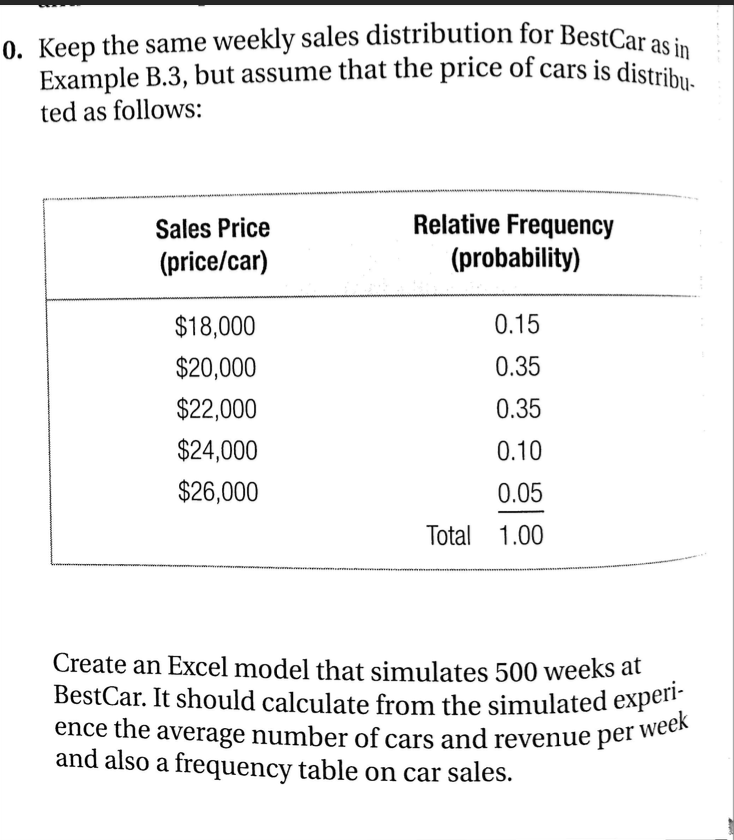
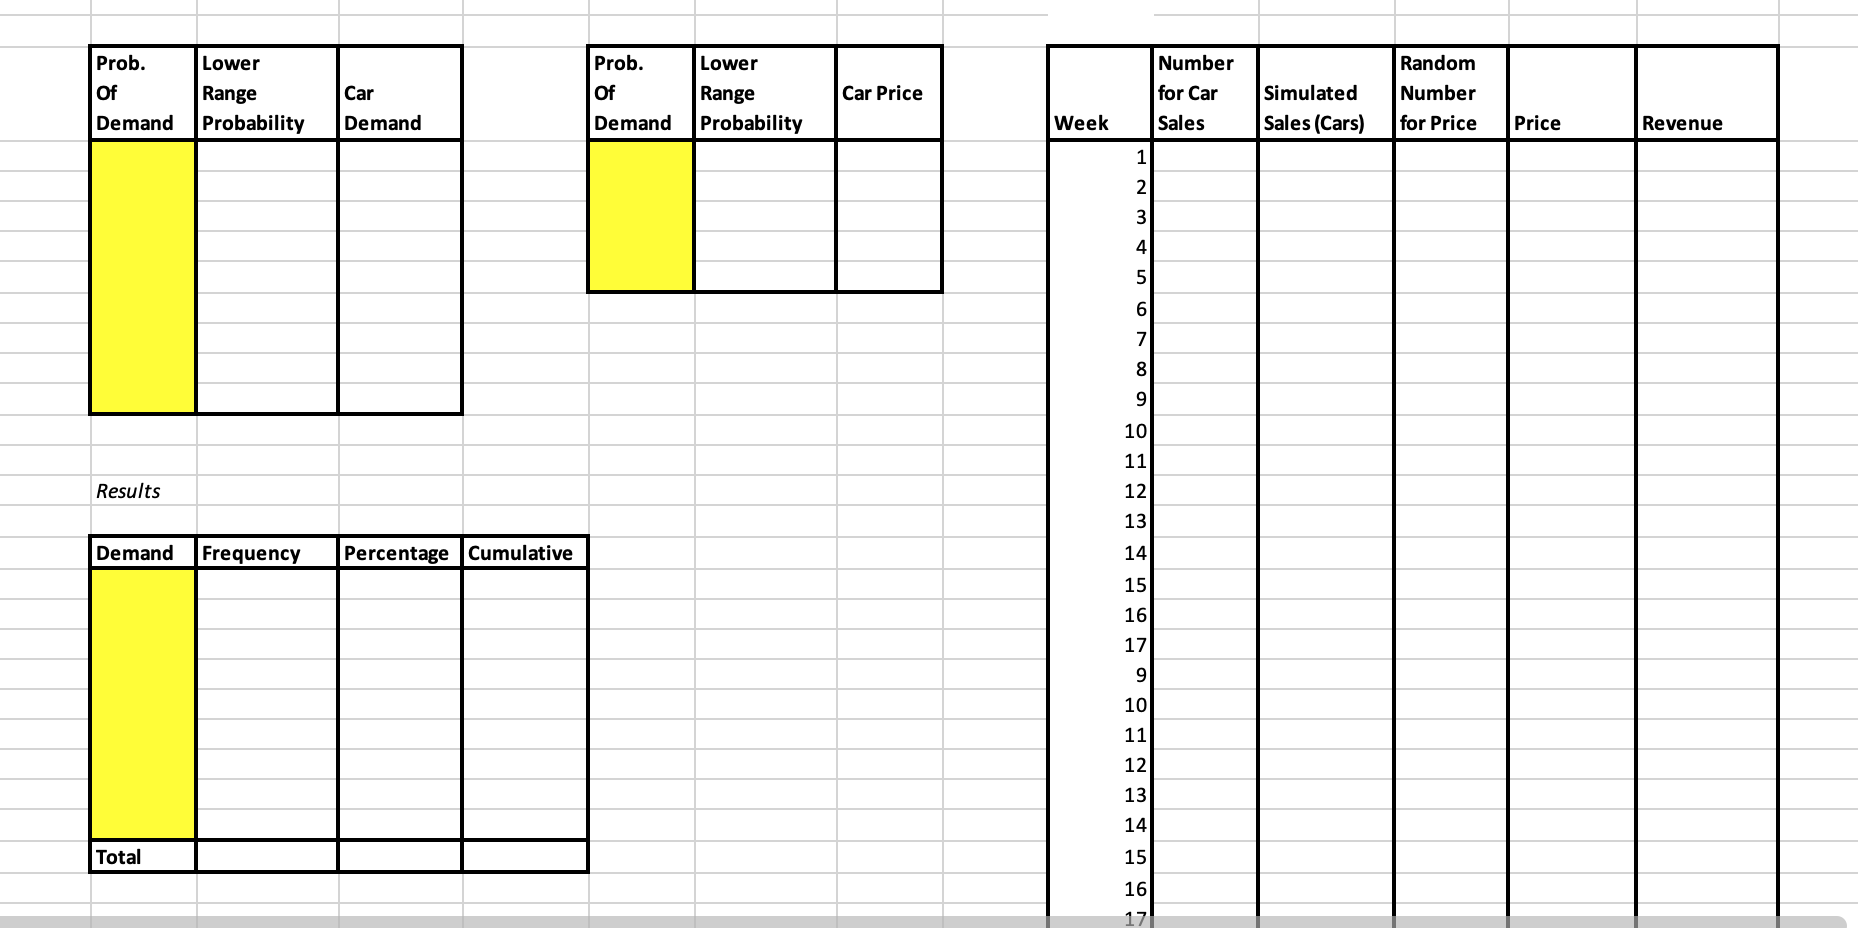
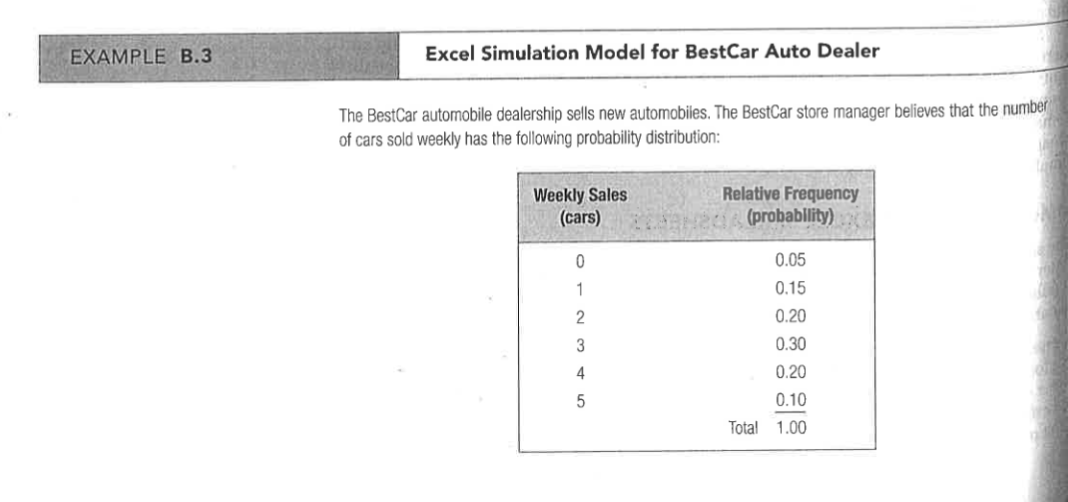
Question: Please answer in Excel Excel template Example B.3 0. Keep the same weekly sales distribution for BestCar as in Example B.3, but assume that the

Please answer in Excel

Please answer in Excel Excel template Example B.3

Excel template

Please answer in Excel Excel template Example B.3

Example B.3

Please answer in Excel Excel template Example B.3

0. Keep the same weekly sales distribution for BestCar as in Example B.3, but assume that the price of cars is distribu. ted as follows: Sales Price (price/car) Relative Frequency (probability) 0.15 0.35 $18,000 $20,000 $22,000 $24,000 $26,000 0.35 0.10 0.05 Total 1.00 Create an Excel model that simulates 500 weeks at BestCar. It should calculate from the simulated experi- ence the average number of cars and revenue per and also a frequency table on car sales. week Lower Prob. Of Demand Lower Range Probability Prob. Of Demand Car Demand Car Price Range Probability Number for Car Sales Simulated Sales (Cars) Random Number for Price Week Price Revenue 1 2 3 4 5 6 7 8 000 9 11 Results 12 13 Demand Frequency Percentage Cumulative 14 15 16 17 ? 3 4 5 99 3 4 5 9 10 11 12 13 14 Total 15 16 17 EXAMPLE B.3 Excel Simulation Model for BestCar Auto Dealer The BestCar automobile dealership sells new automobiles. The BestCar store manager believes that the number of cars sold weekly has the following probability distribution: Weekly Sales (cars) Relative Frequency (probabllity) 0 1 2 3 4 5 0.05 0.15 0.20 0.30 0.20 0.10 Total 1.00

Step by Step Solution

There are 3 Steps involved in it

1 Expert Approved Answer
Step: 1 Unlock blur-text-image
Question Has Been Solved by an Expert!

Get step-by-step solutions from verified subject matter experts

Step: 2 Unlock
Step: 3 Unlock

Students Have Also Explored These Related General Management Questions!