

Question: please answer in excel form with excel equations showing Ascuti 2017 2018 Growth Hate 7.0% 18.04 Payout ratio 25% Using a percentage of sales approach,
please answer in excel form with excel equations showing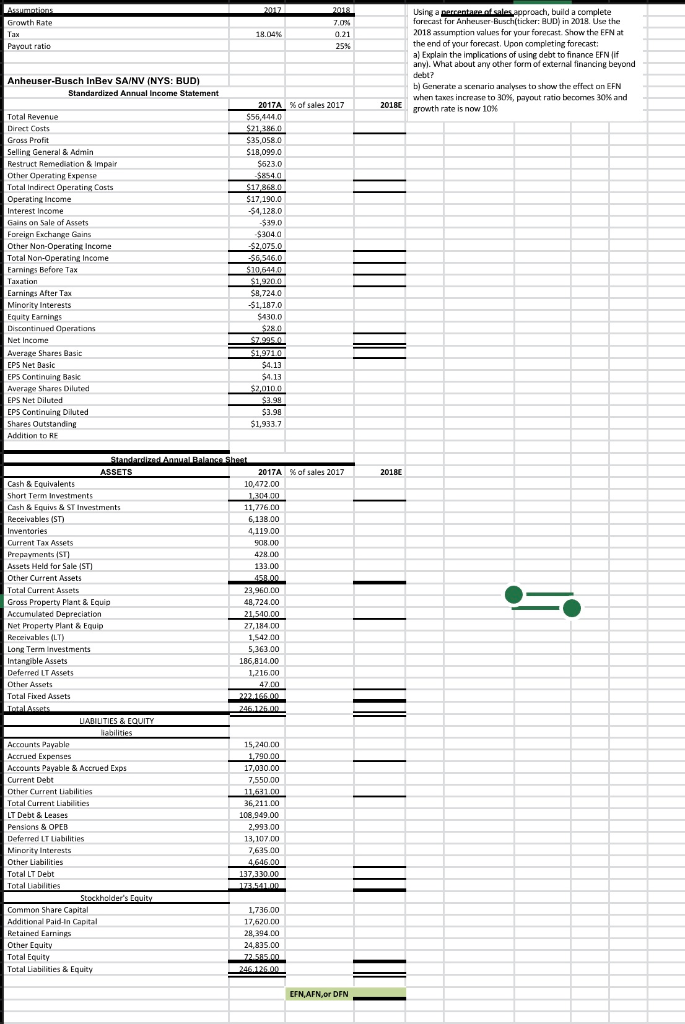
Ascuti 2017 2018 Growth Hate 7.0% 18.04 Payout ratio 25% Using a percentage of sales approach, build a complete forecast for Anheuser Buschticker: BUD) in 2018. Use the 2018 assumption values for your forecast. Show the EFN at the end of your forecast. Upon completing forecast: a) Explain the implications of using debt to finance EFN if anyl. What about any other form of external financing beyond debt? b) Generate a scenario analyses to show the effect on EFN when taxes increase to 30%, payout ratio becomes 30% and growth rate is now 10% Anheuser-Busch InBev SA/NV (NYS: BUD) Standardized Annual Income Statement 2018E Total Revenue Direct Costs Gross Profit Selling General & Admin Restruct Remediation & Impair Other Operating Expense Total Indirect Operating costs Operating Income Interest Income Gains on Sale of Assets Foreign Exchange Gains Other Non-Operating Income Total Non-Operating Income Earnings Before Tax Taxation Earnings After Tax Minority Interests Equity Earnings Discontinued Operations Net Income Average Shares Basic EPS Net Basic EPS Continuing Basic Average Shares Diluted EPS Net Diluted EPS Continuing Diluted Shares Outstanding Addition to RE 2017A % of sales 2017 $55,444.0 $21 386.0 $35,058.0 $18,099.0 $623.0 $854.01 $12,868.0 $17.190.0 $4,128.0 -$39.0 $3040 $2,075.0 -$6,546.0 $10544.0 $1,9200 $8.724.0 $1,187.0 $430,0 $280 $7.995.0 S1.9710 $4.13 $4.13 $2,010.0 $3.99 $3.98 $1,933.7 2018 428.00 Standardized Annual Balance Sheet ASSETS 2017A % of sales 2017 Cash & Equivalents 10,472.00 Short Term Investments 1,304.00 Cash & Equips & ST Investments 11,776.00 Receivables (ST) 6,138.00 Inventories 4,119.00 Current Tax Assets 908 00 Prepayments (ST) Assets Held for Sale (ST) 133.00 Other Current Assets 450.00 Total Current Assets 23,960.00 Gross Property Plant & Equip 48,724.00 Accumulated Depreciation 21.540.00 Net Property Plant & Equip 27,184.00 Receivables (LT) 1,542.00 Long Term investments 5,363.00 Intangible Assets 186,814.00 Deferred LT Assets 1,216.00 Other Assets 47.00 Total Fixed Assets 222.166.00 Total Assets 246.125.00 UABILITIES & EQUITY liabilities Accounts Payable 15,240.00 Accrued Expenses 1.790.00 Accounts Payable & Accrued Exps 17,030.00 Current Debt 7,550,00 Other Current Liabilities 11,631.00 Total Current Liabilities 36,211.00 LT Debt & Leases 108.949.00 Pensions & OPEB 2.99300 Deferred LT Liabilities 13, 107.00 Minority Interests 2,635.00 Other Liabilities 4.646.00 Total LT Debt 137.330.00 Total abilities 172.5410 Stockholder's Equity Common Share Capital 1,736.00 Additional Paid in Capital 17,520.00 Retained Earnings 28,394 00 Other Equity 24,835.00 Total Equity 72 585.00 Total Liabilities & Equity 246126.00 EFNAFN or DFN Ascuti 2017 2018 Growth Hate 7.0% 18.04 Payout ratio 25% Using a percentage of sales approach, build a complete forecast for Anheuser Buschticker: BUD) in 2018. Use the 2018 assumption values for your forecast. Show the EFN at the end of your forecast. Upon completing forecast: a) Explain the implications of using debt to finance EFN if anyl. What about any other form of external financing beyond debt? b) Generate a scenario analyses to show the effect on EFN when taxes increase to 30%, payout ratio becomes 30% and growth rate is now 10% Anheuser-Busch InBev SA/NV (NYS: BUD) Standardized Annual Income Statement 2018E Total Revenue Direct Costs Gross Profit Selling General & Admin Restruct Remediation & Impair Other Operating Expense Total Indirect Operating costs Operating Income Interest Income Gains on Sale of Assets Foreign Exchange Gains Other Non-Operating Income Total Non-Operating Income Earnings Before Tax Taxation Earnings After Tax Minority Interests Equity Earnings Discontinued Operations Net Income Average Shares Basic EPS Net Basic EPS Continuing Basic Average Shares Diluted EPS Net Diluted EPS Continuing Diluted Shares Outstanding Addition to RE 2017A % of sales 2017 $55,444.0 $21 386.0 $35,058.0 $18,099.0 $623.0 $854.01 $12,868.0 $17.190.0 $4,128.0 -$39.0 $3040 $2,075.0 -$6,546.0 $10544.0 $1,9200 $8.724.0 $1,187.0 $430,0 $280 $7.995.0 S1.9710 $4.13 $4.13 $2,010.0 $3.99 $3.98 $1,933.7 2018 428.00 Standardized Annual Balance Sheet ASSETS 2017A % of sales 2017 Cash & Equivalents 10,472.00 Short Term Investments 1,304.00 Cash & Equips & ST Investments 11,776.00 Receivables (ST) 6,138.00 Inventories 4,119.00 Current Tax Assets 908 00 Prepayments (ST) Assets Held for Sale (ST) 133.00 Other Current Assets 450.00 Total Current Assets 23,960.00 Gross Property Plant & Equip 48,724.00 Accumulated Depreciation 21.540.00 Net Property Plant & Equip 27,184.00 Receivables (LT) 1,542.00 Long Term investments 5,363.00 Intangible Assets 186,814.00 Deferred LT Assets 1,216.00 Other Assets 47.00 Total Fixed Assets 222.166.00 Total Assets 246.125.00 UABILITIES & EQUITY liabilities Accounts Payable 15,240.00 Accrued Expenses 1.790.00 Accounts Payable & Accrued Exps 17,030.00 Current Debt 7,550,00 Other Current Liabilities 11,631.00 Total Current Liabilities 36,211.00 LT Debt & Leases 108.949.00 Pensions & OPEB 2.99300 Deferred LT Liabilities 13, 107.00 Minority Interests 2,635.00 Other Liabilities 4.646.00 Total LT Debt 137.330.00 Total abilities 172.5410 Stockholder's Equity Common Share Capital 1,736.00 Additional Paid in Capital 17,520.00 Retained Earnings 28,394 00 Other Equity 24,835.00 Total Equity 72 585.00 Total Liabilities & Equity 246126.00 EFNAFN or DFN
Step by Step Solution
There are 3 Steps involved in it

Get step-by-step solutions from verified subject matter experts