

Question: please answer in excel with formula Source Line: Course Technology/Cengage Learning. FIGURE 4-14 Fitter's production plan for January: The first five weeks of production are
please answer in excel with formula
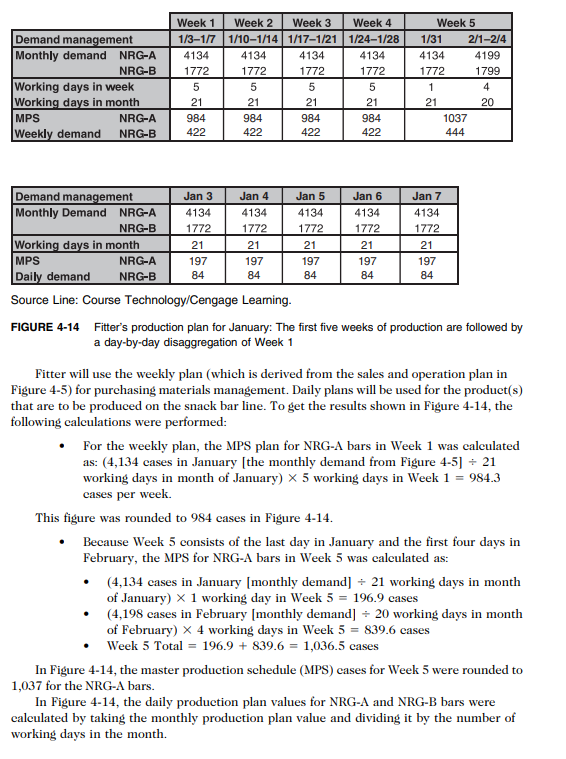
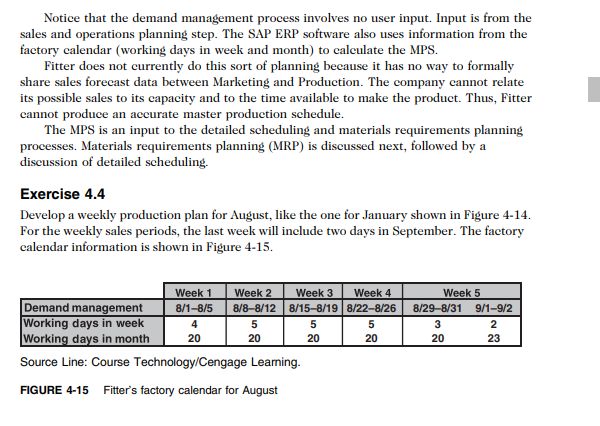
Source Line: Course Technology/Cengage Learning. FIGURE 4-14 Fitter's production plan for January: The first five weeks of production are followed by a day-by-day disaggregation of Week 1 Fitter will use the weekly plan (which is derived from the sales and operation plan in Figure 4-5) for purehasing materials management. Daily plans will be used for the product(s) that are to be produced on the snack bar line. To get the results shown in Figure 4-14, the following calculations were performed: - For the weekly plan, the MPS plan for NRG-A bars in Week 1 was calculated as: (4,134 cases in January [the monthly demand from Figure 45 ] 21 working days in month of January) 5 working days in Week 1=984.3 cases per week. This figure was rounded to 984 cases in Figure 4-14. - Because Week 5 consists of the last day in January and the first four days in February, the MPS for NRG-A bars in Week 5 was calculated as: - (4,134 eases in January [monthly demand] 21 working days in month of January 1 working day in Week 5=196.9 cases - (4,198 cases in February [monthly demand] 20 working days in month of February) 4 working days in Week 5=839.6 cases - Week 5 Total =196.9+839.6=1,036.5 cases In Figure 4-14, the master production schedule (MPS) cases for Week 5 were rounded to 1,037 for the NRG-A bars. In Figure 4-14, the daily production plan values for NRG-A and NRG-B bars were calculated by taking the monthly production plan value and dividing it by the number of working days in the month. Notice that the demand management process involves no user input. Input is from the sales and operations planning step. The SAP ERP software also uses information from the factory calendar (working days in week and month) to calculate the MPS. Fitter does not currently do this sort of planning because it has no way to formally share sales forecast data between Marketing and Production. The company cannot relate its possible sales to its capacity and to the time available to make the product. Thus, Fitter cannot produce an accurate master production schedule. The MPS is an input to the detailed scheduling and materials requirements planning processes. Materials requirements planning (MRP) is discussed next, followed by a discussion of detailed scheduling. Exercise 4.4 Develop a weekly production plan for August, like the one for January shown in Figure 4-14. For the weekly sales periods, the last week will include two days in September. The factory calendar information is shown in Figure 4-15. Source Line: Course Technology/Cengage Learning. FIGURE 4-15 Fitter's factory calendar for August Source Line: Course Technology/Cengage Learning. FIGURE 4-14 Fitter's production plan for January: The first five weeks of production are followed by a day-by-day disaggregation of Week 1 Fitter will use the weekly plan (which is derived from the sales and operation plan in Figure 4-5) for purehasing materials management. Daily plans will be used for the product(s) that are to be produced on the snack bar line. To get the results shown in Figure 4-14, the following calculations were performed: - For the weekly plan, the MPS plan for NRG-A bars in Week 1 was calculated as: (4,134 cases in January [the monthly demand from Figure 45 ] 21 working days in month of January) 5 working days in Week 1=984.3 cases per week. This figure was rounded to 984 cases in Figure 4-14. - Because Week 5 consists of the last day in January and the first four days in February, the MPS for NRG-A bars in Week 5 was calculated as: - (4,134 eases in January [monthly demand] 21 working days in month of January 1 working day in Week 5=196.9 cases - (4,198 cases in February [monthly demand] 20 working days in month of February) 4 working days in Week 5=839.6 cases - Week 5 Total =196.9+839.6=1,036.5 cases In Figure 4-14, the master production schedule (MPS) cases for Week 5 were rounded to 1,037 for the NRG-A bars. In Figure 4-14, the daily production plan values for NRG-A and NRG-B bars were calculated by taking the monthly production plan value and dividing it by the number of working days in the month. Notice that the demand management process involves no user input. Input is from the sales and operations planning step. The SAP ERP software also uses information from the factory calendar (working days in week and month) to calculate the MPS. Fitter does not currently do this sort of planning because it has no way to formally share sales forecast data between Marketing and Production. The company cannot relate its possible sales to its capacity and to the time available to make the product. Thus, Fitter cannot produce an accurate master production schedule. The MPS is an input to the detailed scheduling and materials requirements planning processes. Materials requirements planning (MRP) is discussed next, followed by a discussion of detailed scheduling. Exercise 4.4 Develop a weekly production plan for August, like the one for January shown in Figure 4-14. For the weekly sales periods, the last week will include two days in September. The factory calendar information is shown in Figure 4-15. Source Line: Course Technology/Cengage Learning. FIGURE 4-15 Fitter's factory calendar for August
Step by Step Solution
There are 3 Steps involved in it

Get step-by-step solutions from verified subject matter experts