

Question: Please Answer it Clear & Correctly 2. The following is a scatterplot of miles per gallon against weight for 32 different types of automobiles (from
Please Answer it Clear & Correctly

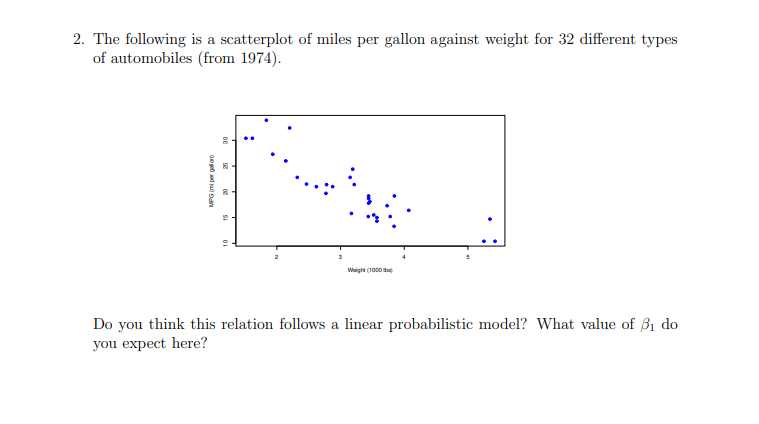
2. The following is a scatterplot of miles per gallon against weight for 32 different types of automobiles (from 1974). Weight (1000 1be) Do you think this relation follows a linear probabilistic model? What value of B, do you expect here
Step by Step Solution
There are 3 Steps involved in it
1 Expert Approved Answer
Step: 1 Unlock

Question Has Been Solved by an Expert!
Get step-by-step solutions from verified subject matter experts
Step: 2 Unlock
Step: 3 Unlock