

Question: please answer Learning Goal: To graph position, velocity, and acceleration of an object given a table of positions vs. time. The table below shows the

please answer
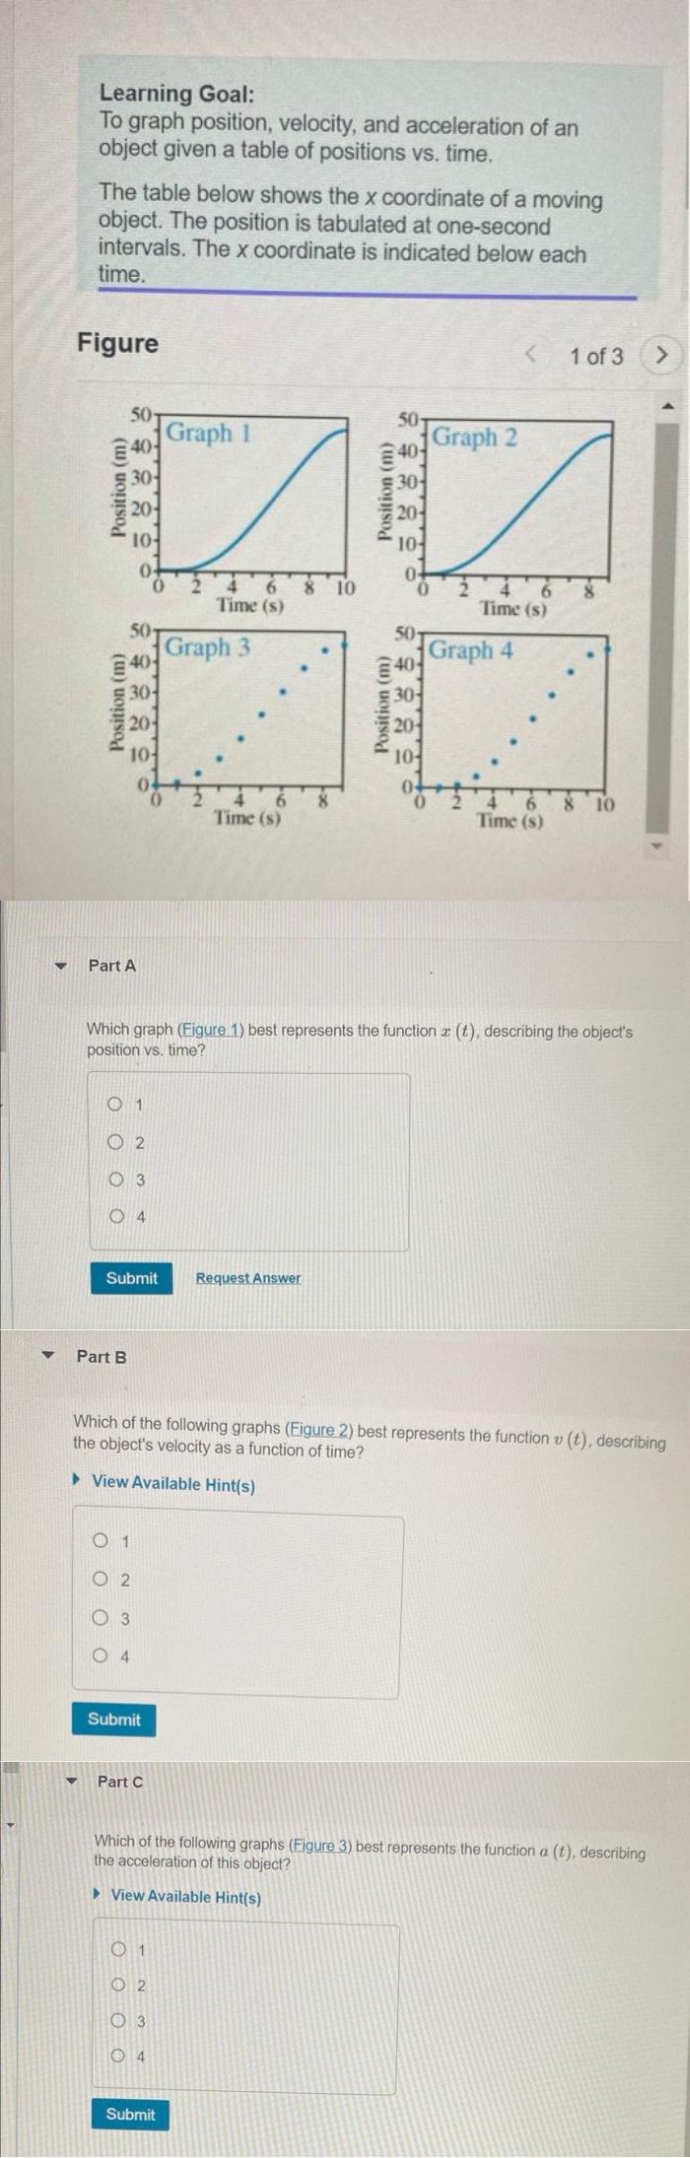
Learning Goal: To graph position, velocity, and acceleration of an object given a table of positions vs. time. The table below shows the x coordinate of a moving object. The position is tabulated at one-second intervals. The x coordinate is indicated below each time. Figure 50 40- Graph 1 Graph 2 E 40- 30- 30- Position (m) 20- Position 20- 6 310 4 Time (s) Time (s) 50 50 Graph 3 Graph 4 40- 40 30- 30 Position (m) Position (m) 20- 10- 8 10 Time (s) Time (s) Part A Which graph (Figure 1) best represents the function z (t), describing the object's position vs. time? O 1 O 2 3 0 4 Submit Request Answer Part B Which of the following graphs (Figure 2) best represents the function u (t), describing the object's velocity as a function of time? View Available Hint(s) 1 O 2 3 4 Submit Part C Which of the following graphs (Figure 3) best represents the function a (t), describing the acceleration of this object? View Available Hint(s) 2 3 0 4 Submit
Step by Step Solution
There are 3 Steps involved in it

Get step-by-step solutions from verified subject matter experts