

Question: please answer my doubts , will rate a good answer 3.1.3 Fourier Basis as Sinusoidal Waves To better understand the effect of the Fourier transform
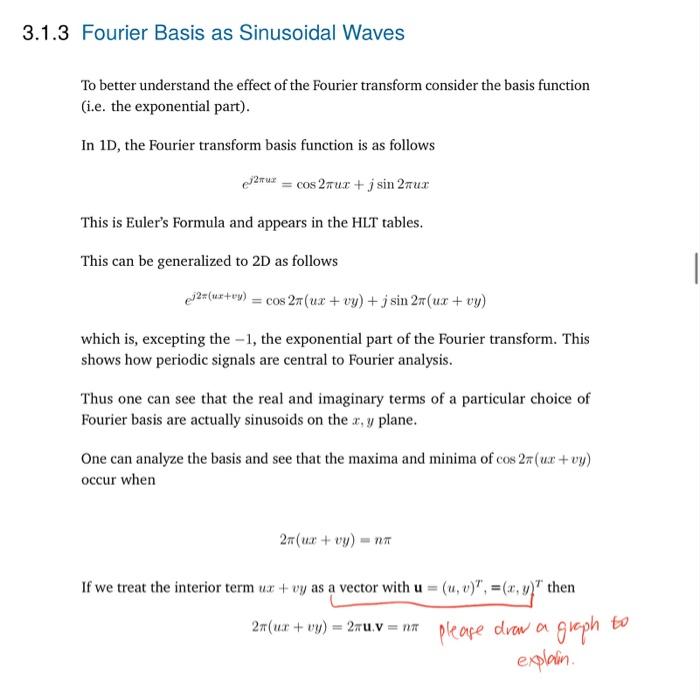
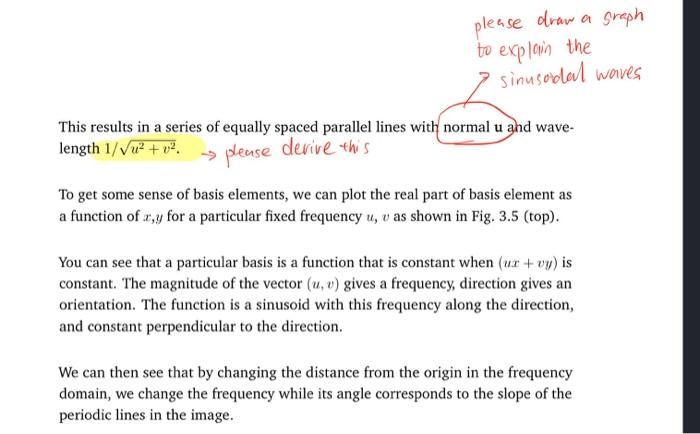
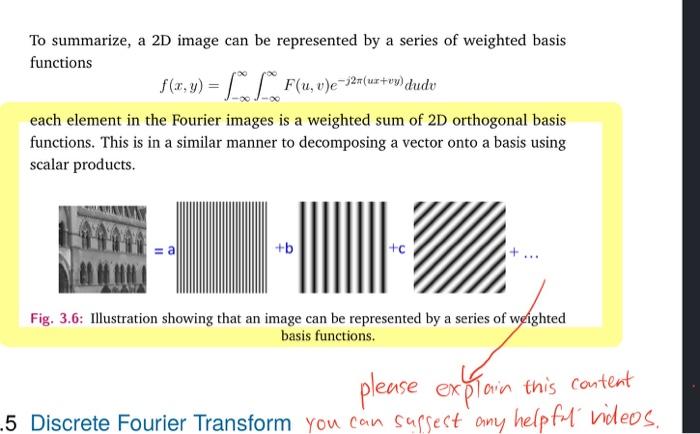
3.1.3 Fourier Basis as Sinusoidal Waves To better understand the effect of the Fourier transform consider the basis function (i.e. the exponential part). In 1D, the Fourier transform basis function is as follows 242 = cos 2 ur + j sin 2x This is Euler's Formula and appears in the HLT tables. This can be generalized to 2D as follows 329(0x+wy) = cos 24(ux + vy) +jsin 27(ux + vy) which is, excepting the - 1, the exponential part of the Fourier transform. This shows how periodic signals are central to Fourier analysis. Thus one can see that the real and imaginary terms of a particular choice of Fourier basis are actually sinusoids on the x, y plane. One can analyze the basis and see that the maxima and minima of cos 2.(ux + vy) occur when 27 (ux + vy) - If we treat the interior term uz +wy as a vector with u = (u, v)", =(x,y)" then 26(ux + wy) = 2#u.V = 11 please drew a explain graph to please draw a graph to explain the sinusoidal waves This results in a series of equally spaced parallel lines with normal u and wave- length 1/V2 + 02. > please derive this To get some sense of basis elements, we can plot the real part of basis element as a function of x,y for a particular fixed frequency u, v as shown in Fig. 3.5 (top). You can see that a particular basis is a function that is constant when (ur + v) is constant. The magnitude of the vector (u, v) gives a frequency, direction gives an orientation. The function is a sinusoid with this frequency along the direction, and constant perpendicular to the direction. We can then see that by changing the distance from the origin in the frequency domain, we change the frequency while its angle corresponds to the slope of the periodic lines in the image. To summarize, a 2D image can be represented by a series of weighted basis functions = LLF(u, v)e=321(u+ow dudu each element in the Fourier images is a weighted sum of 2D orthogonal basis functions. This is in a similar manner to decomposing a vector onto a basis using scalar products. +b + Fig. 3.6: Illustration showing that an image can be represented by a series of weighted basis functions. please explain this content -5 Discrete Fourier Transform you can supsest any helpful videos
Step by Step Solution
There are 3 Steps involved in it

Get step-by-step solutions from verified subject matter experts