

Question: Please answer only Question 2. Thank you! Problem C: QUESTION 2: Look at the graph in PROBLEM C. For a fixed implied volatility, we see
Please answer only Question 2. Thank you!
Problem C:
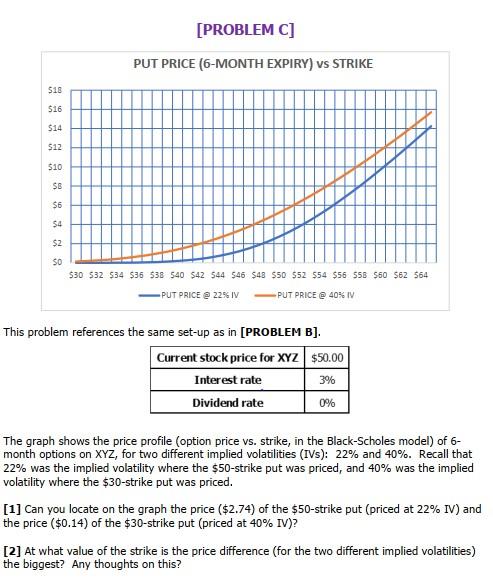
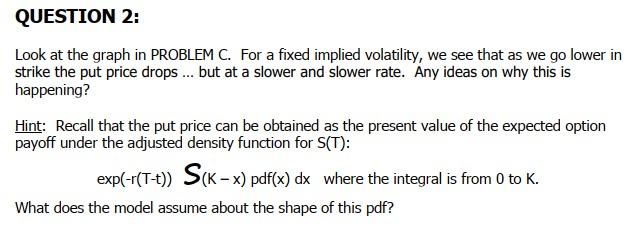
QUESTION 2: Look at the graph in PROBLEM C. For a fixed implied volatility, we see that as we go lower in strike the put price drops ... but at a slower and slower rate. Any ideas on why this is happening? Hint: Recall that the put price can be obtained as the present value of the expected option payoff under the adjusted density function for S(T): exp(-r(T-t)) S(K - x) pdf(x) dx where the integral is from 0 to K. What does the model assume about the shape of this pdf? [PROBLEM C] PUT PRICE (6-MONTH EXPIRY) vs STRIKE $18 $16 514 $12 $10 SB $6 $4 $2 SO $30 532 534 $36 538 540 542 544 $46 $43 $50 $52 554 $56 555 $50 $62 564 PUT PRICE @ 2256 IV PUT PRICE @ 40% IV This problem references the same set-up as in [PROBLEM B]. Current stock price for XYZ $50.00 Interest rate 3% Dividend rate 0% The graph shows the price profile (option price vs. strike, in the Black-Scholes model) of 6- month options on XYZ, for two different implied volatilities (IVs): 22% and 40%. Recall that 22% was the implied volatility where the $50-strike put was priced, and 40% was the implied volatility where the $30-strike put was priced. [1] Can you locate on the graph the price ($2.74) of the $50-strike put (priced at 22% IV) and the price ($0.14) of the $30-strike put (priced at 40% IV)? [2] At what value of the strike is the price difference (for the two different implied volatilities) the biggest? Any thoughts on this? QUESTION 2: Look at the graph in PROBLEM C. For a fixed implied volatility, we see that as we go lower in strike the put price drops ... but at a slower and slower rate. Any ideas on why this is happening? Hint: Recall that the put price can be obtained as the present value of the expected option payoff under the adjusted density function for S(T): exp(-r(T-t)) S(K - x) pdf(x) dx where the integral is from 0 to K. What does the model assume about the shape of this pdf? [PROBLEM C] PUT PRICE (6-MONTH EXPIRY) vs STRIKE $18 $16 514 $12 $10 SB $6 $4 $2 SO $30 532 534 $36 538 540 542 544 $46 $43 $50 $52 554 $56 555 $50 $62 564 PUT PRICE @ 2256 IV PUT PRICE @ 40% IV This problem references the same set-up as in [PROBLEM B]. Current stock price for XYZ $50.00 Interest rate 3% Dividend rate 0% The graph shows the price profile (option price vs. strike, in the Black-Scholes model) of 6- month options on XYZ, for two different implied volatilities (IVs): 22% and 40%. Recall that 22% was the implied volatility where the $50-strike put was priced, and 40% was the implied volatility where the $30-strike put was priced. [1] Can you locate on the graph the price ($2.74) of the $50-strike put (priced at 22% IV) and the price ($0.14) of the $30-strike put (priced at 40% IV)? [2] At what value of the strike is the price difference (for the two different implied volatilities) the biggest? Any thoughts on this
Step by Step Solution
There are 3 Steps involved in it

Get step-by-step solutions from verified subject matter experts