

Question: Please answer ONLY questions 5, 6 and 7. Page 60 and 137 formulas provided here in image 4 and 5 . Thanks! YMR CHARTS USING
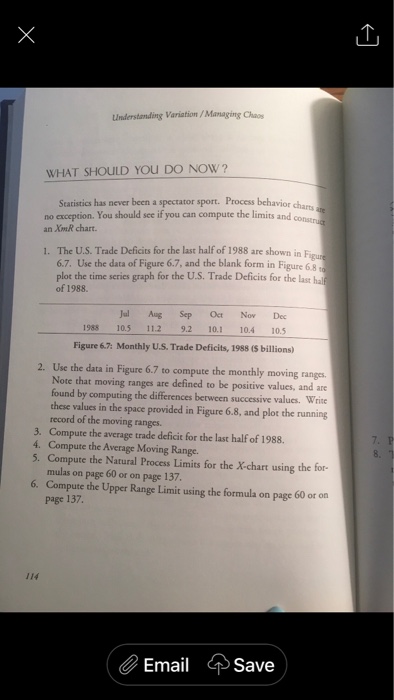
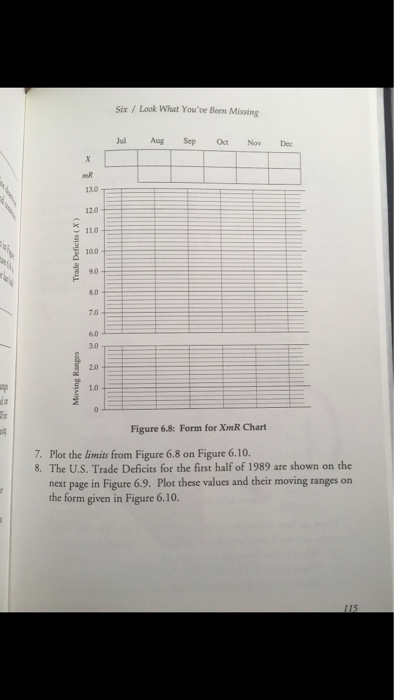
Please answer ONLY questions 5, 6 and 7.Page 60 and 137 formulas provided here in image 4 and 5. Thanks!
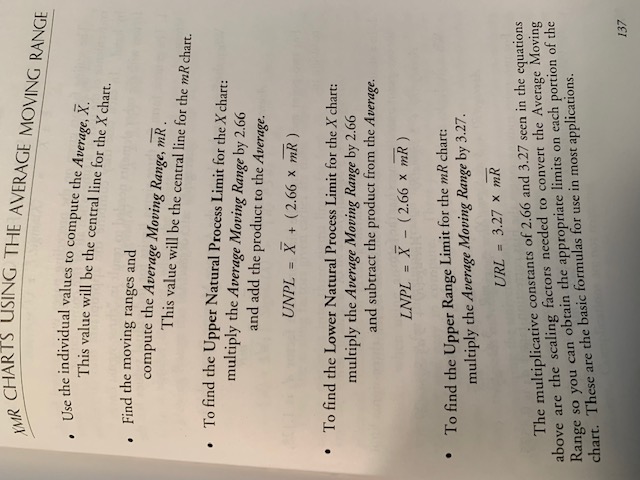
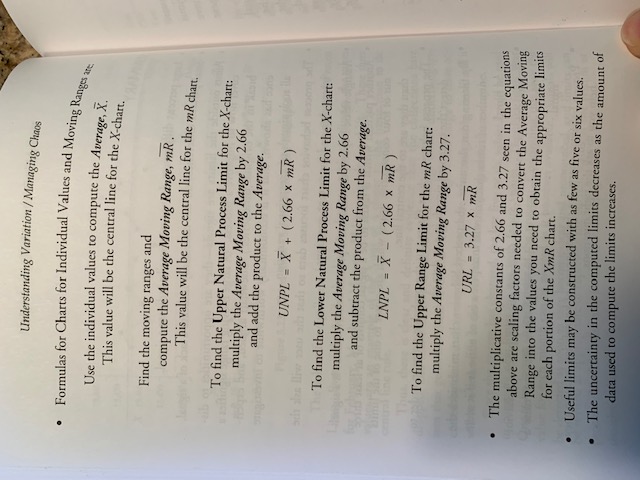
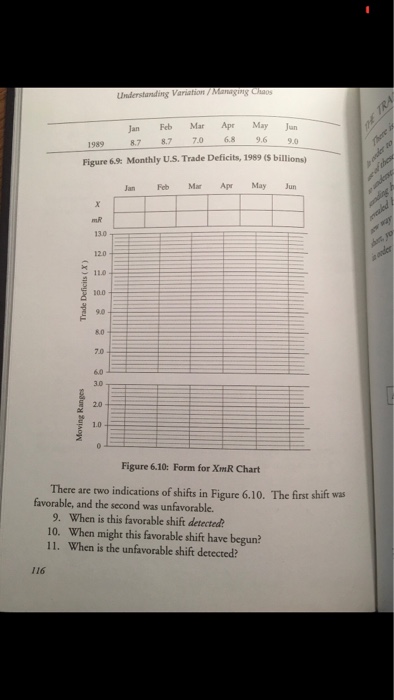
YMR CHARTS USING THE AVERAGE MOVING RANGE . Use the individual values to compute the Average, X. This value will be the central line for the X chart. . Find the moving ranges and compute the Average Moving Range, mR . This value will be the central line for the mR chart. . To find the Upper Natural Process Limit for the X chart: multiply the Average Moving Range by 2.66 and add the product to the Average. UNPL = X + (2.66 x mR ) . To find the Lower Natural Process Limit for the X chart: multiply the Average Moving Range by 2.66 and subtract the product from the Average. LNPL = X - (2.66 x mR ) . To find the Upper Range Limit for the mR chart: multiply the Average Moving Range by 3.27. URL = 3.27 X mR The multiplicative constants of 2.66 and 3.27 seen in the equations above are the scaling factors needed to convert the Average Moving Range so you can obtain the appropriate limits on each portion of the chart. These are the basic formulas for use in most applications. 137Understanding Variation / Managing Chaos " Formulas for Charts for Individual Values and Moving Ranges are Use the individual values to compute the Average, X. This value will be the central line for the X-chart. Find the moving ranges and compute the Average Moving Range, MR . This value will be the central line for the mR chart. To find the Upper Natural Process Limit for the X-chart: multiply the Average Moving Range by 2.66 and add the product to the Average. weed cons UNPL = X + (2.66 x mR ) To find the Lower Natural Process Limit for the X-chart: multiply the Average Moving Range by 2.66 and subtract the product from the Average. LNPL = X - (2.66 * mR ) To find the Upper Range Limit for the mR chart: multiply the Average Moving Range by 3.27. URL = 3.27 x mR . The multiplicative constants of 2.66 and 3.27 seen in the equations above are scaling factors needed to convert the Average Moving Range into the values you need to obtain the appropriate limits for each portion of the XR chart. Useful limits may be constructed with as few as five or six values. . The uncertainty in the computed limits decreases as the amount of data used to compute the limits increases.\f\f\f
Step by Step Solution
There are 3 Steps involved in it

Get step-by-step solutions from verified subject matter experts