

Question: please answer organized ly A certain town is located approximately 25 miles east of a large city, The data organized below include the appraised value
please answer organized ly
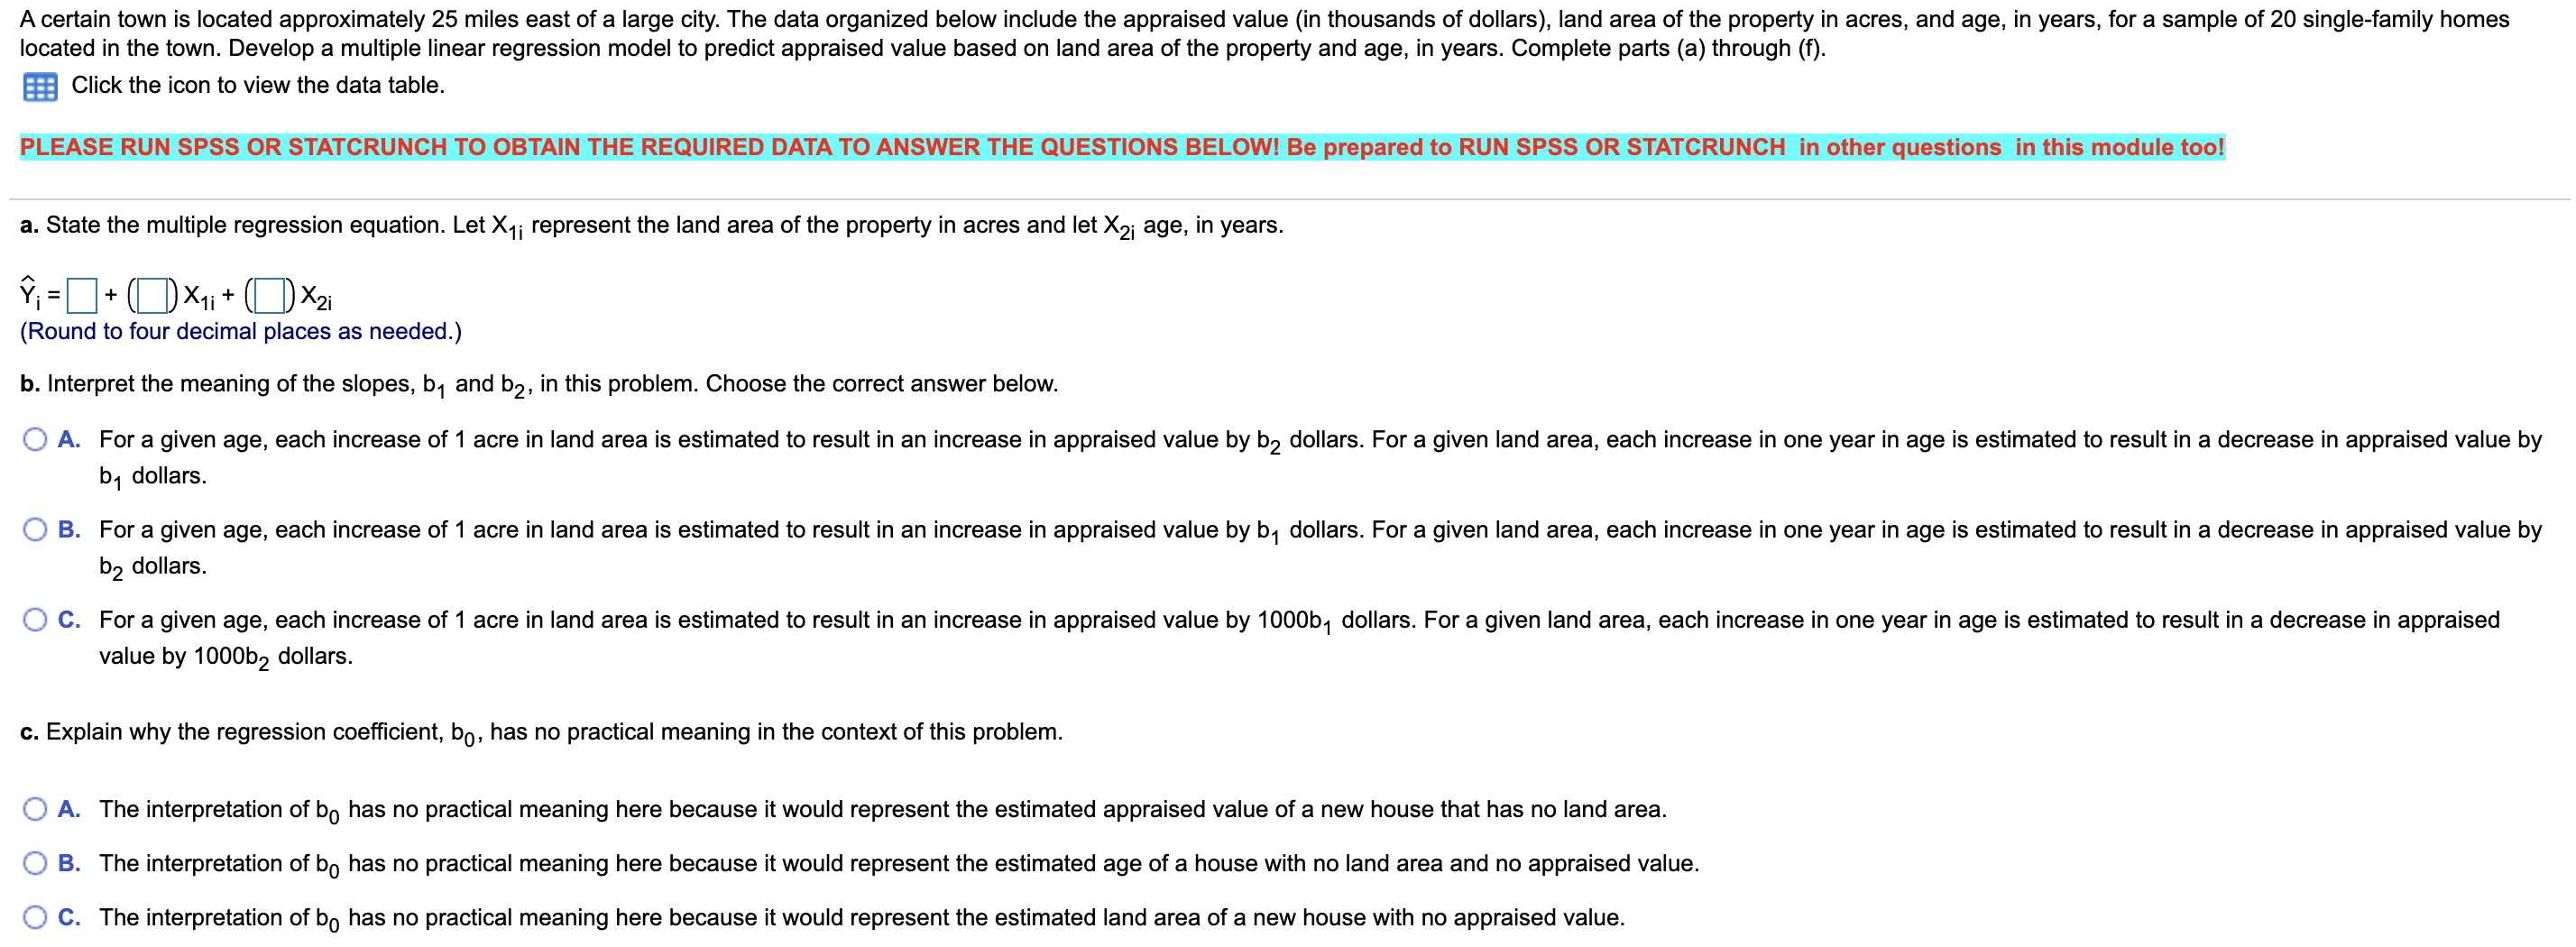
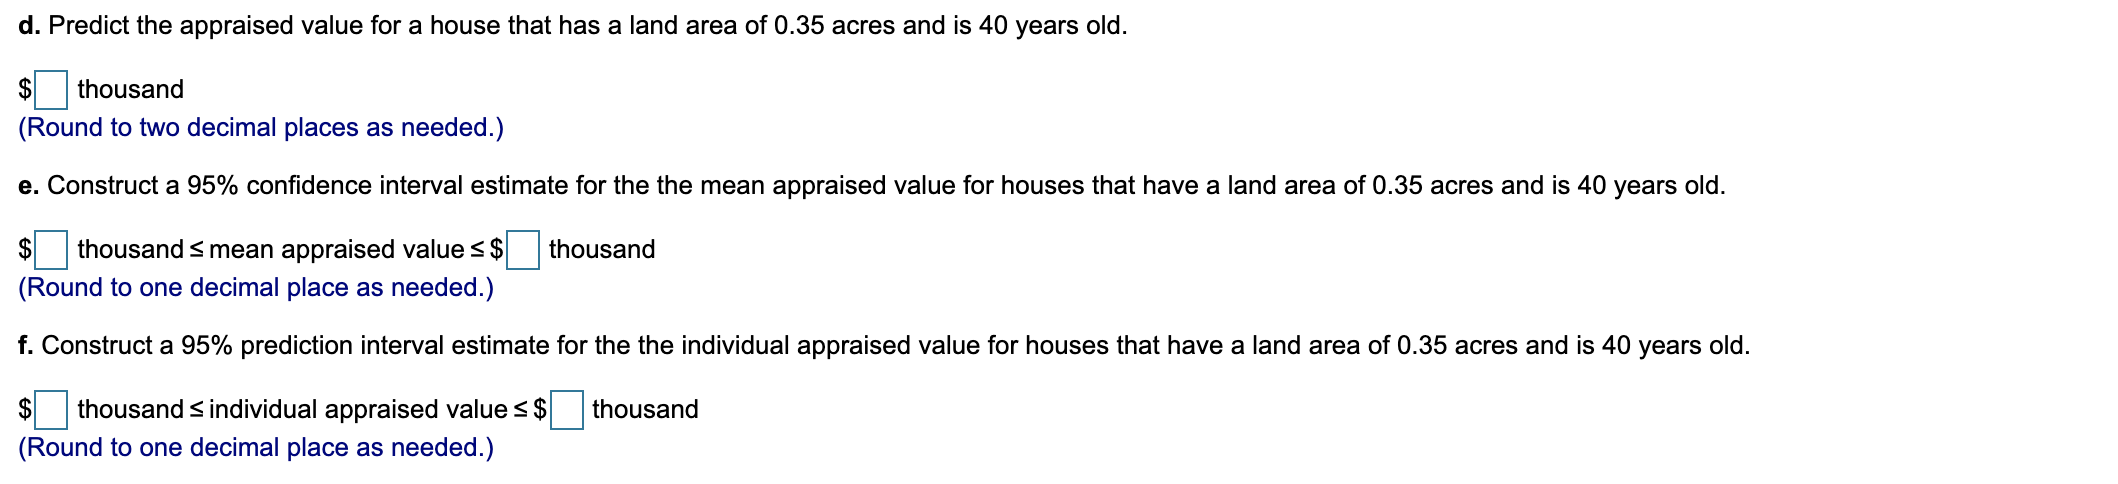
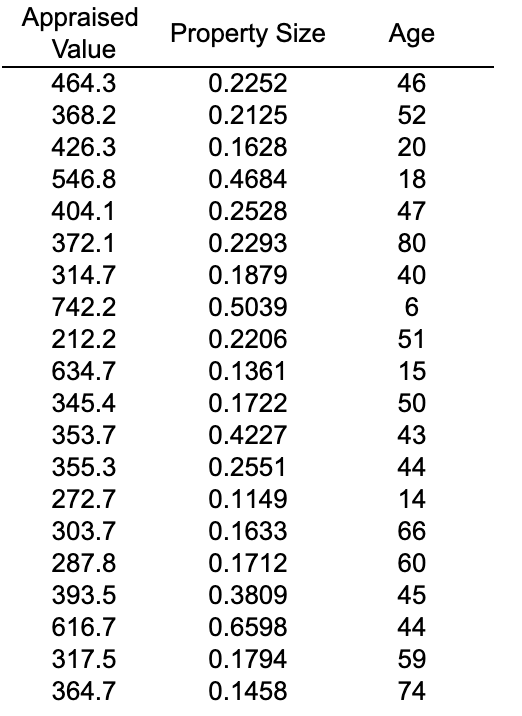
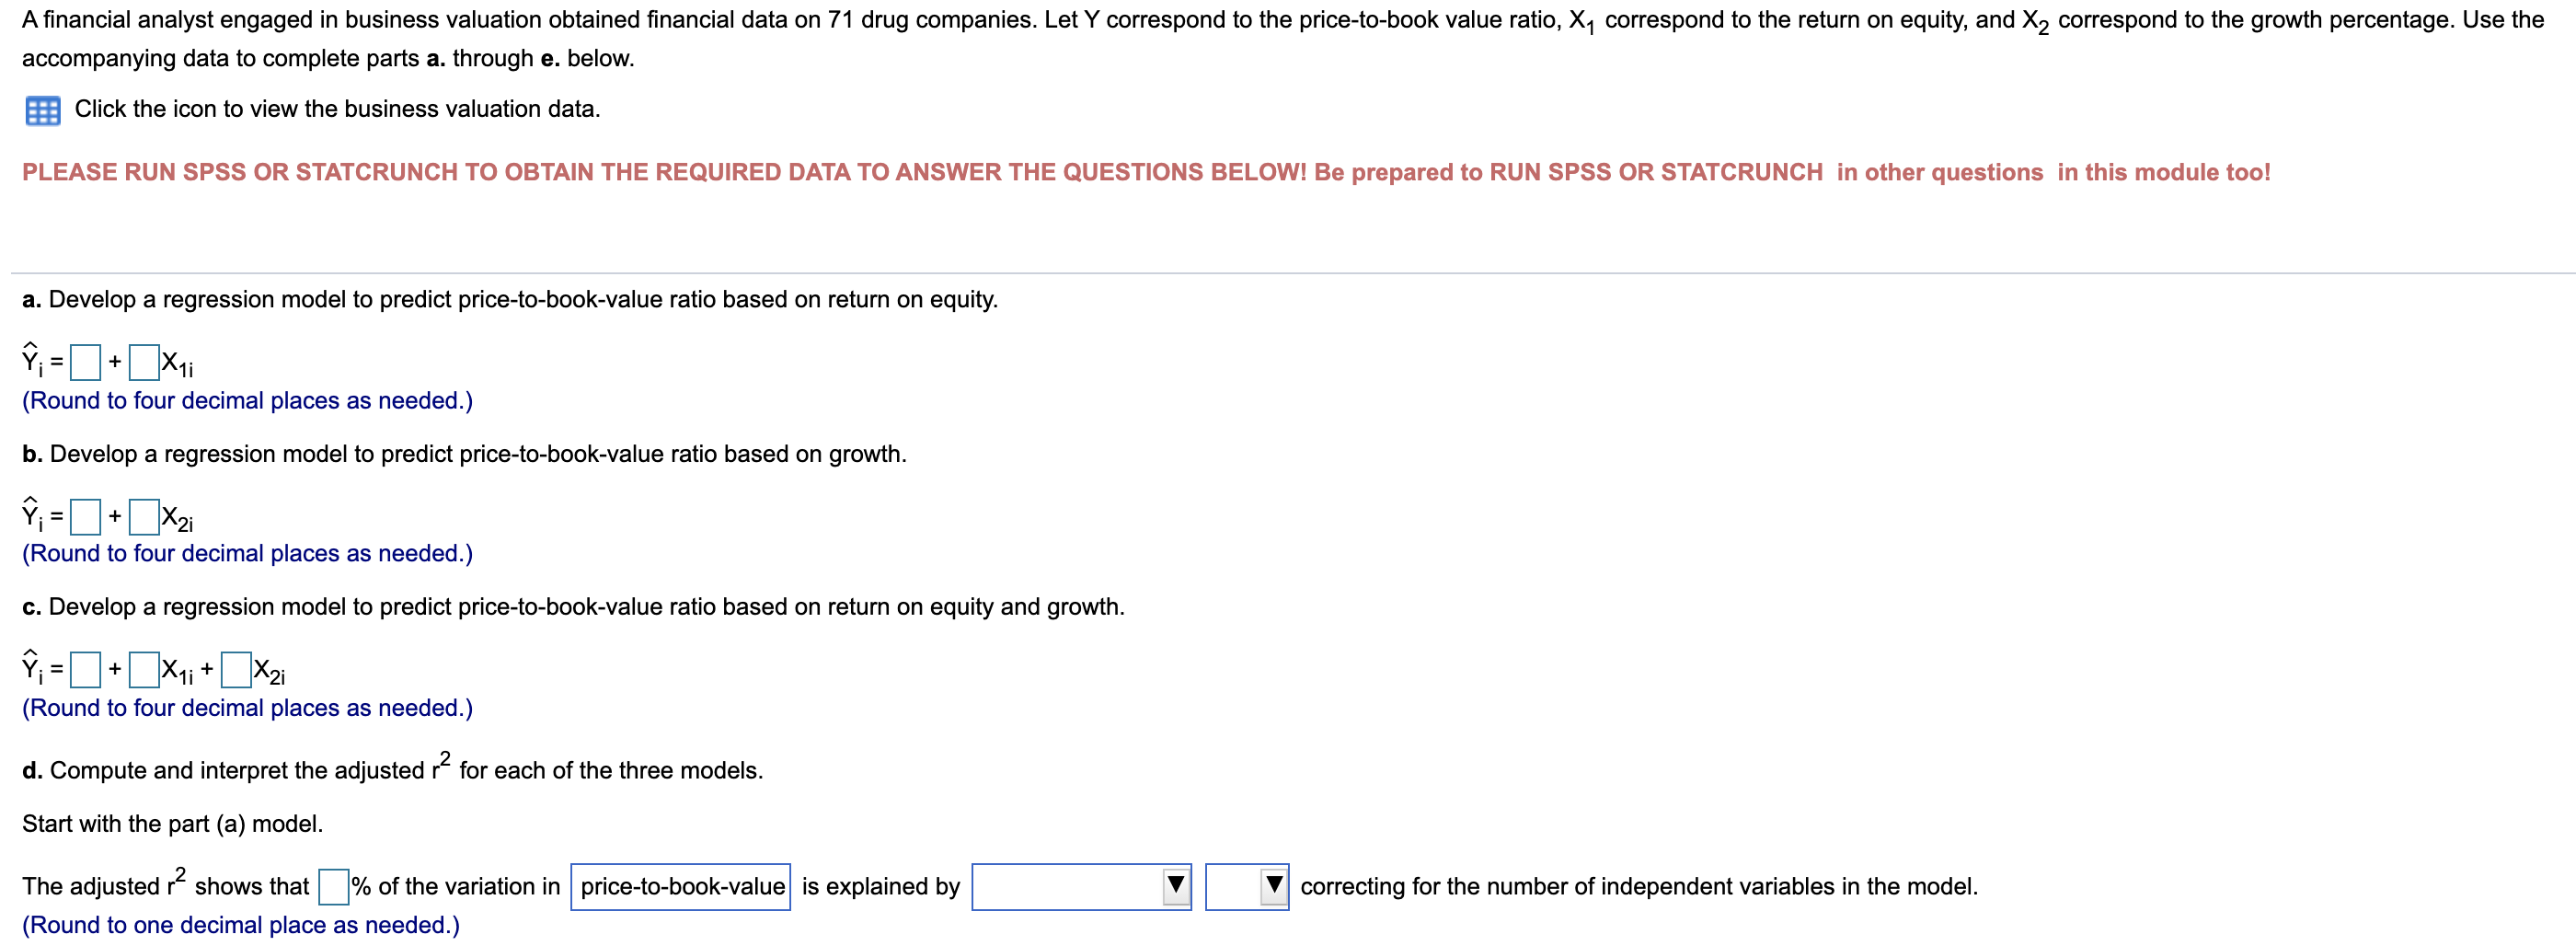
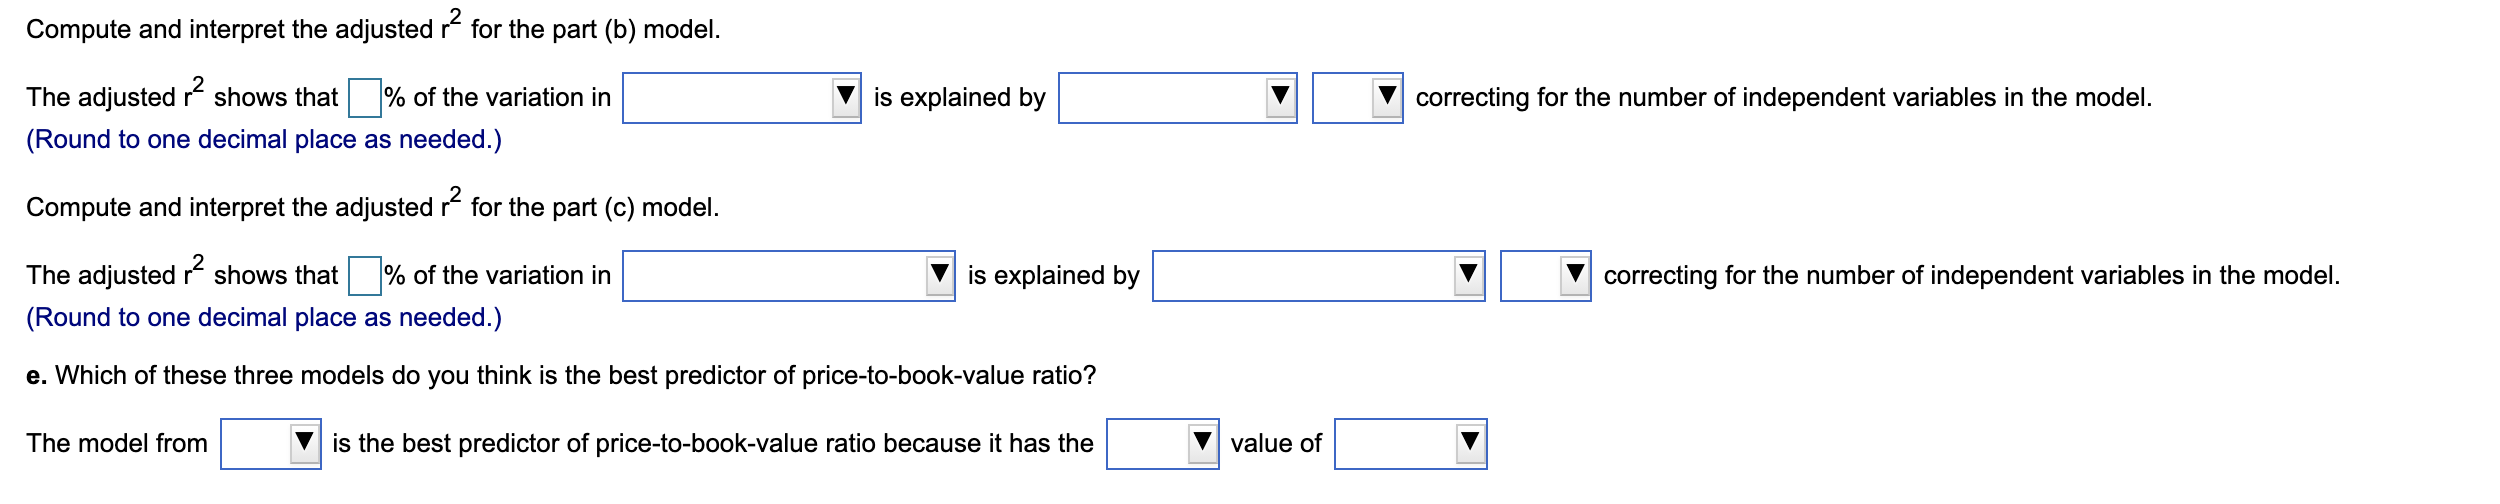
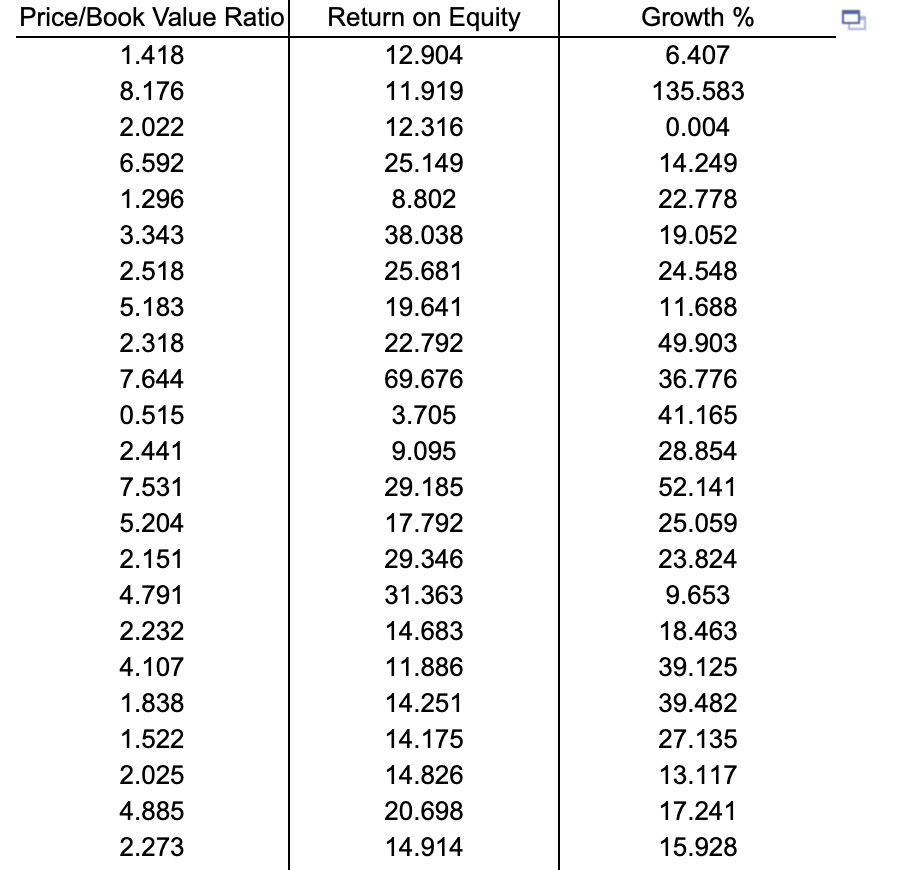
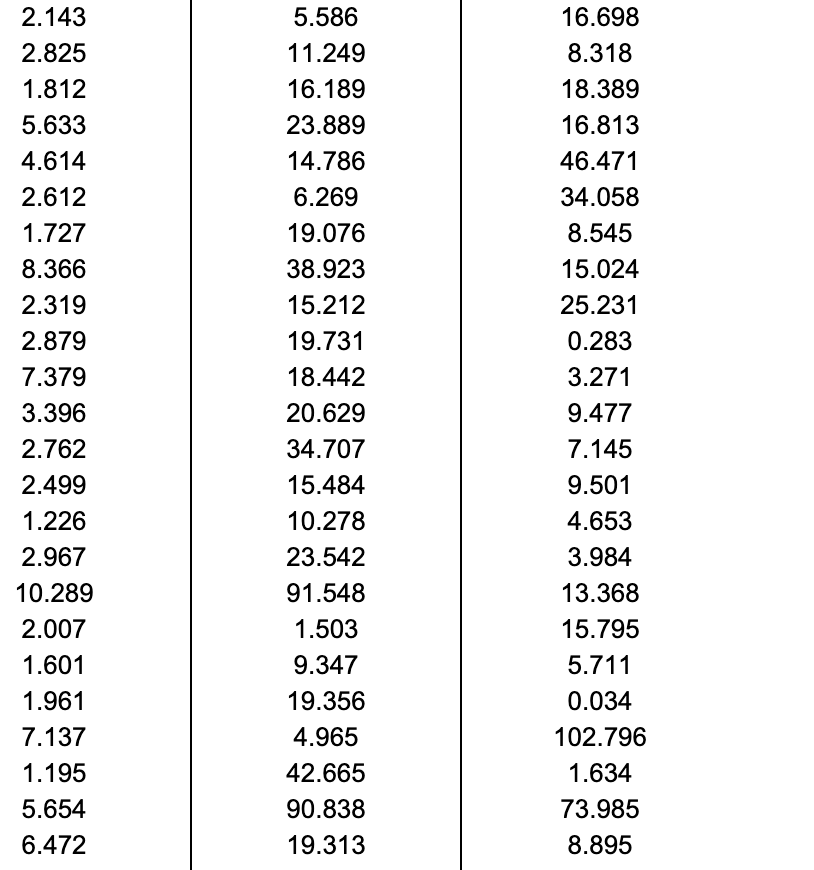
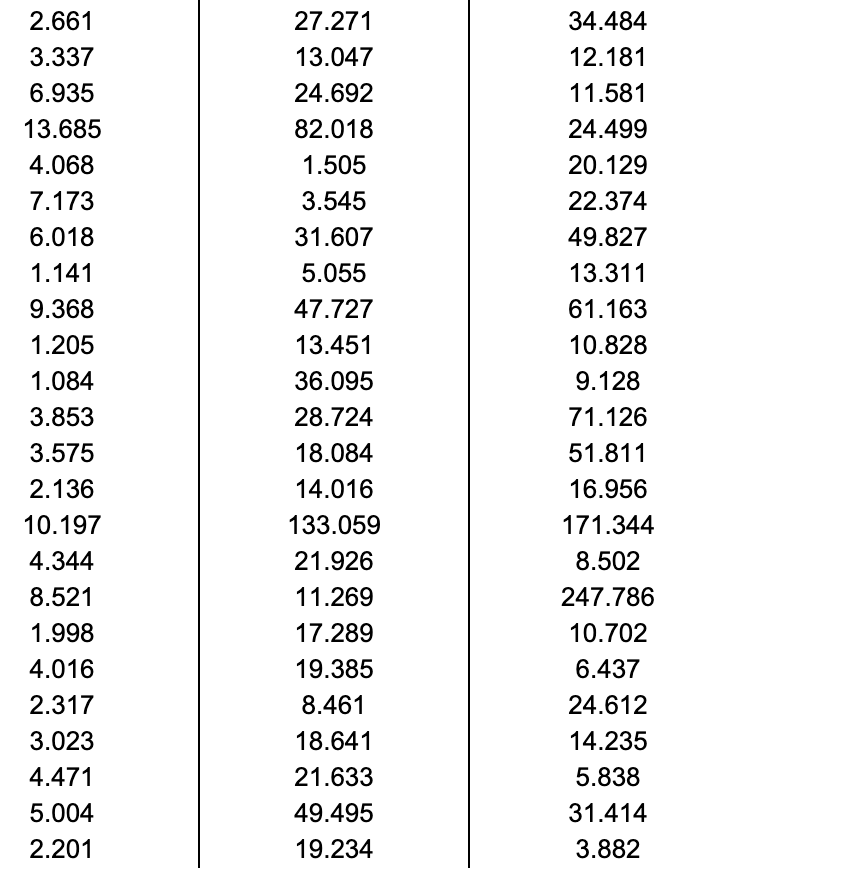
A certain town is located approximately 25 miles east of a large city, The data organized below include the appraised value (in thousands of dollars), land area of the property in acres, and age, in years, for a sample of 20 single-family homes located in the town. Develop a multiple linear regression model to predict appraised value based on land area of the property and age, in years. Complete parts (a) through (f). a Click the icon to view the data table. PLEASE RUN SPSS OR STATCRUNCH TO OBTAIN THE REQUIRED DATA TO ANSWER THE QUESTIONS BELOW! Be prepared to RUN SPSS OR STATCRUNCH In other questions In thls module tool a. State the multiple regression equation, Let X\" represent the land area of the property in acres and let X2i age, in years. A Yi = + X" + X2i (Round to four decimal places as needed.) b. Interpret the meaning of the slopes, b1 and b2, in this problem. Choose the correct answer below. 0 A. For a given age, each increase of 1 acre in land area is estimated to result in an increase in appraised value by b2 dollars. For a given land area, each increase in one year in age is estimated to result in a decrease in appraised value by b1 dollars. 0 B. For a given age, each increase of 1 acre in land area is estimated to result in an increase in appraised value by b1 dollars. For a given land area, each increase in one year in age is estimated to result in a decrease in appraised value by b2 dollars. 0 c. For a given age, each increase of 1 acre in land area is estimated to result in an increase in appraised value by 1000b1 dollars. For a given land area, each increase in one year in age is estimated to result in a decrease in appraised value by 1000b2 dollars. 0. Explain why the regression coefcient. b0, has no practical meaning in the context of this problem. 0 A. The interpretation of b has no practical meanin here because it would represent the estimated appraised value of a new house that has no land area. 0 9 O B. The interpremtion of bo has no practical meaning here because it would represent the estimated age of a house with no land area and no appraised value. 0 C. The interpretation of Do has no practical meaning here because it would represent the estimated land area of a new house with no appraised value. d. Predict the appraised value for a house that has a land area of 0.35 acres and is 40 years old. :5 thousand (Round to two decimal places as needed.) 9. Construct a 95% condence interval estimate for the the mean appraised value for houses that have a land area of 0.35 acres and is 40 years old. 35 thousand 5 mean appraised value 5 $ thousand (Round to one decimal place as needed.) f. Construct a 95% prediction interval estimate for the the individual appraised value for houses that have a land area of 0.35 acres and is 40 years old. :5 thousand 5 individual appraised value 5 35 thousand (Round to one decimal place as needed.) \fAtinancial analyst engaged in business valuation obtained nancial data on 71 drug companies. Let Y correspond to the price-t -book value ratio, X1 correspond to the return on equity, and X2 correspond to the growth percentage Use the accompanying data to complete parts a. through 0. below. a Click the icon to view the business valuation data. PLEASE RUN SPSS OR STATCRUNCH TO OBTAIN THE REQUIRED DATA TO ANSWER THE QUESTIONS BELOW! Be prepared to RUN SPSS 0R STATCRUNCH in other questions in this module too! a. Develop a regression model to predict prioe-to-bookvalue ratio based on return on equity. qi = + x1i (Round to four decimal places as needed.) b. Develop a regression model to predict prioe-to-bookvalue ratio based on growth. ?i = " X2i (Round to four decimal places as needed.) c. Develop a regression model to predict prioe-to-bookvalue ratio based on return on equity and growth. ?i = + X\" + X2i (Round to four decimal places as needed.) d. Compute and interpret the adjusted r2 for each of the three models. Start with the part (a) model. The adjusted r2 shows that /o ot the variation in prioe-to-book-value is explained by i V correcting for the number of independent variables in the model. (Round to one decimal place as needed.) Compute and interpret the adjusted r2 for the part (b) model. The adjusted r2 shows that % of the variation in (Round to one decimal place as needed.) Compute and interpret the adjusted r2 for the part (0) model. The adjusted r2 shows that % of the variation in 7 (Round to one decimal place as needed.) ii is explained by is explained by e. Which of these three models do you think is the best predictor of price-tobook-value ratio? The model from E is the best predictor of price-to-bookvalue ratio because it has the value of [ correcting for the number of independent variables in the model. correcting for the number of independent variables in the model. \f\f\f
Step by Step Solution
There are 3 Steps involved in it

Get step-by-step solutions from verified subject matter experts