

Question: please answer part a and b. New car sales for a dealer in Cook County, Illinois, for the past year are shown in the following
please answer part a and b.
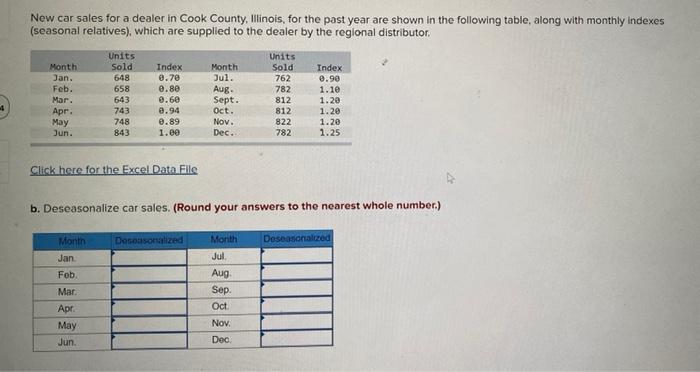
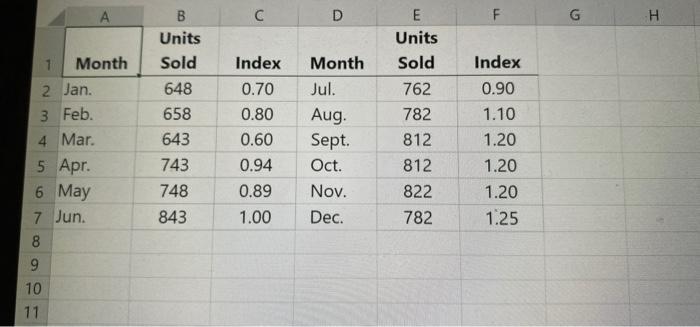
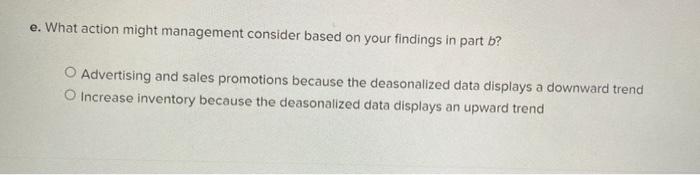
New car sales for a dealer in Cook County, Illinois, for the past year are shown in the following table, along with monthly Indexes (seasonal relatives), which are supplied to the dealer by the regional distributor. Units Units Month Sold Index Month Sold Index Jan. 648 0.70 Jul. 762 0.90 Feb. 658 0.80 Aug 782 1.10 Mar. 643 0.60 Sept. 1.20 Apr. 743 0.94 Oct. 812 1.20 May 748 0.89 Nov. 822 1.20 Jun. 843 1.ee Dec. 782 1.25 812 -- Click here for the Excel Data File b. Deseasonalize car sales. (Round your answers to the nearest whole number.) Dosonsonalized Deseasonalced Month Jan Fob. Mar. Month Jul Aug Sep. Oct Nov. Apr May Jun. Dec A C D D F F G H H 1 Month 2 Jan. 3 Feb. 4 Mar. 5 Apr. 6 May 7 Jun. 8 9 10 11 B Units Sold 648 658 643 743 748 843 Index 0.70 0.80 0.60 0.94 0.89 1.00 Month Jul. Aug. Sept. Oct. Nov. Dec. E Units Sold 762 782 812 812 822 782 Index 0.90 1.10 1.20 1.20 1.20 1.25 e. What action might management consider based on your findings in part b? Advertising and sales promotions because the deasonalized data displays a downward trend Increase inventory because the deasonalized data displays an upward trend Step by Step Solution
There are 3 Steps involved in it
1 Expert Approved Answer
Step: 1 Unlock

Question Has Been Solved by an Expert!
Get step-by-step solutions from verified subject matter experts
Step: 2 Unlock
Step: 3 Unlock