

Question: PLEASE ANSWER PART (c) USING EXCEL I III 6. The following table contains the probability distribution for the returns of three securities over the next
 PLEASE ANSWER PART (c) USING EXCEL
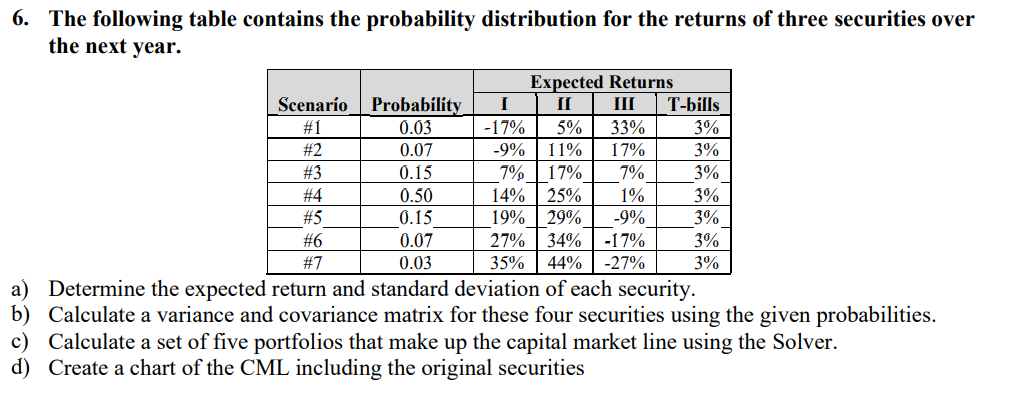
I III 6. The following table contains the probability distribution for the returns of three securities over the next year. Expected Returns Scenaro Probability T-bills #1 0.03 -17% 5% 33% 3% #2 0.07 -9% 11% 17% 3% #3 0.15 7% 17% 7% 3% #4 0.50 14% 25% 1% 3% #5 0.15 19% 29% 3% #6 0.07 27% 34% -17% 3% #7 0.03 35% 44% -27% 3% a) Determine the expected return and standard deviation of each security. b) Calculate a variance and covariance matrix for these four securities using the given probabilities. c) Calculate a set of five portfolios that make up the capital market line using the Solver. d) Create a chart of the CML including the original securities -9% I III 6. The following table contains the probability distribution for the returns of three securities over the next year. Expected Returns Scenaro Probability T-bills #1 0.03 -17% 5% 33% 3% #2 0.07 -9% 11% 17% 3% #3 0.15 7% 17% 7% 3% #4 0.50 14% 25% 1% 3% #5 0.15 19% 29% 3% #6 0.07 27% 34% -17% 3% #7 0.03 35% 44% -27% 3% a) Determine the expected return and standard deviation of each security. b) Calculate a variance and covariance matrix for these four securities using the given probabilities. c) Calculate a set of five portfolios that make up the capital market line using the Solver. d) Create a chart of the CML including the original securities -9%
Step by Step Solution
There are 3 Steps involved in it

Get step-by-step solutions from verified subject matter experts