

Question: Please answer problem #14 Parts A and B, SHOWING ALL WORK ON ALL PARTS ACCORDINGLY. Thank you! Here are comparative statement data for Oriole Company
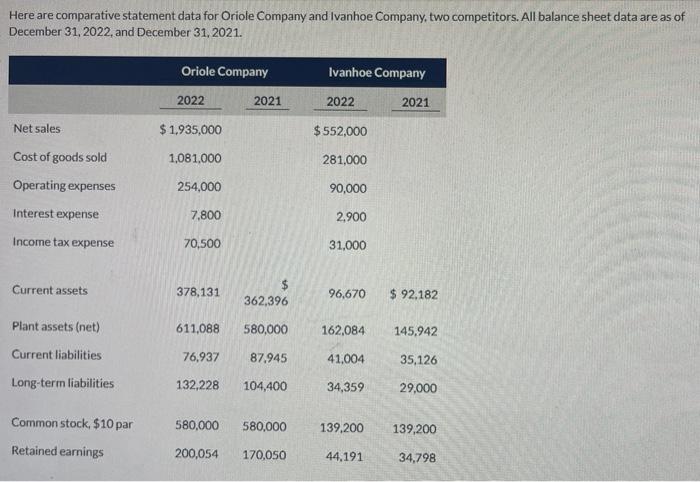
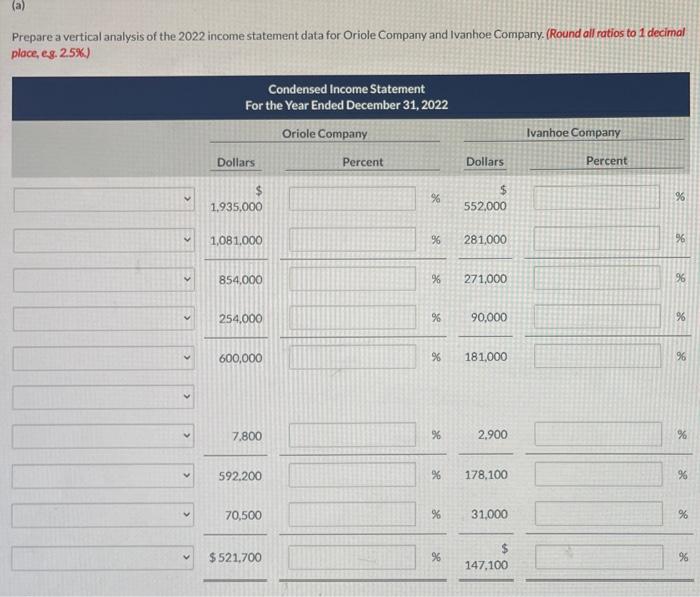
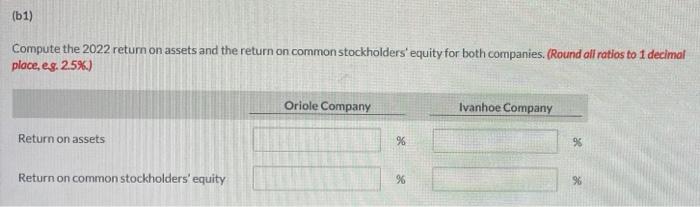
Here are comparative statement data for Oriole Company and Ivanhoe Company, two competitors. All balance sheet data are as of December 31, 2022, and December 31, 2021. Oriole Company Ivanhoe Company 2022 2021 2022 2021 Net sales $ 1.935,000 $ 552,000 Cost of goods sold 1,081,000 281,000 Operating expenses 254,000 90,000 Interest expense 7.800 2,900 Income tax expense 70,500 31,000 Current assets 378,131 $ 362,396 96,670 $ 92,182 611,088 580,000 162,084 145,942 Plant assets (net) Current liabilities 76,937 87.945 41,004 35,126 Long-term liabilities 132,228 104,400 34,359 29,000 Common stock, $10 par 580,000 580,000 139,200 139,200 Retained earnings 200,054 170,050 44,191 34,798 (a) Prepare a vertical analysis of the 2022 income statement data for Oriole Company and Ivanhoe Company. (Round all ratios to 1 decimal place, eg. 2.5%) Condensed Income Statement For the Year Ended December 31, 2022 Oriole Company Ivanhoe Company Dollars Percent Dollars Percent $ 1.935,000 $ 552,000 % > % 1,081,000 %6 281,000 % se 854,000 % 271.000 96 254,000 % 90,000 % 600,000 % 181.000 96 v 7.800 % 2.900 592,200 % 178,100 % 96 70,500 % 31,000 % $ 521,700 96 $ 147.100 % 96 (61) Compute the 2022 return on assets and the return on common stockholders' equity for both companies. (Round all ratios to 1 decimal place, e.g. 2.5%) Oriole Company Ivanhoe Company Return on assets % 95 Return on common stockholders' equity 96 96
Step by Step Solution
There are 3 Steps involved in it

Get step-by-step solutions from verified subject matter experts