

Question: PLEASE ANSWER PROBLEM #4 USING BACKGROUND INFO ON MICROSOFT EXCEL AND SHOW FORMULAS. THANKS! PROBLEM 3 BACKGROUND INFO There is substantial cross-sectional variation in the
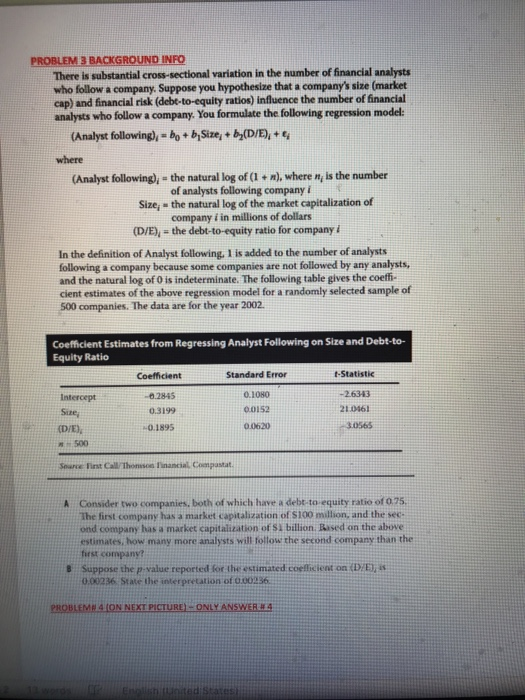
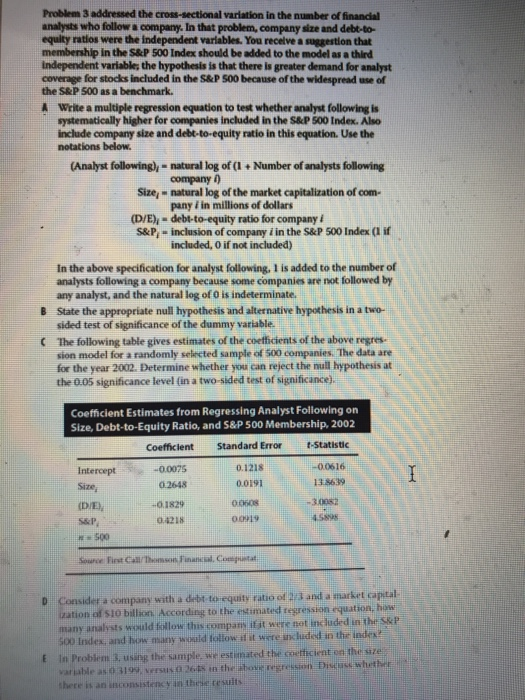
PROBLEM 3 BACKGROUND INFO There is substantial cross-sectional variation in the number of financial analysts who follow a company. Suppose you hypothesize that a company's site (market cap) and financial risk (debt-to-equity ratios) influence the number of financial analysts who follow a company. You formulate the following regression model: (Analyst following) - bo + by Size + b}(D/E), + & where (Analyst following), the natural log of (1 r), where is the number of analysts following company i Size - the natural log of the market capitalization of company i in millions of dollars (D/E), -the debt-to-equity ratio for company i In the definition of Analyst following. I is added to the number of analysts following a company because some companies are not followed by any analysts, and the natural log of is indeterminate. The following table gives the coeff cient estimates of the above regression model for a randomly selected sample of 500 companies. The data are for the year 2002 Coefficient Estimates from Regressing Analyst Following on Size and Debt-to- Equity Ratio Coefficient t-Statistic Standard Error Intercept 0.1080 -2.633 0.2845 0.3199 0.0152 210161 DIE -0.1895 06.20 3055 Set Call A Consider two companies, both of which have a debt-to-equity ratio of 075 The first company has a market capitalization of S100 million, and the sec ond company has a market capitalization of Sibillion based on the above estimates, how many more analysts will follow the second company than the first company? Suppose the p-value reported for the estimated coellicient on (D/E), 0.00236 State the interpretation of 0.00236 PROBLEME 4 (ON NEXT PICTURE) - ONLY ANSWER24 Problem 3 addressed the cross-sectional variation in the number of financial analysts who follow a company. In that problem, company size and debt-to- equity ratios were the Independent variables. You receive a suggestion that membership in the S&P 500 Index should be added to the model as a third independent variable, the hypothesis is that there is greater demand for analyst coverage for stocks included in the S&P 500 because of the widespread use of the S&P 500 as a benchmark. Write a multiple regression equation to test whether analyst following is systematically higher for companies included in the S&P 500 Index. Also include company size and debt-to-equity ratio in this equation. Use the notations below. (Analyst following), - natural log of (1 + Number of analysts following company ) Size, natural log of the market capitalization of com- pany fin millions of dollars (D/E), - debt-to-equity ratio for company i S&P, - inclusion of company i in the S&P 500 Index (1 if included, if not included) B In the above specification for analyst following. I is added to the number of analysts following a company because some companies are not followed by any analyst, and the natural log of is indeterminate State the appropriate null hypothesis and alternative hypothesis in a two- sided test of significance of the dummy variable The following table gives estimates of the coefficients of the above regres. sion model for a randomly selected sample of 500 companies. The data are for the year 2002. Determine whether you can reject the null hypothesis at the 0.05 significance level (in a two-sided test of significance) ( Coefficient Estimates from Regressing Analyst Following on Size, Debt-to-Equity Ratio, and S&P 500 Membership, 2002 Coefficient Standard Error -Statistic Intercept -0.0075 0.1218 -0.0616 Size 0.2648 0.0191 (DIE), -0.1829 00608 -30032 S&P 01218 00019 500 Source is the out D Considera company with a debt te equity ratio of 12 and a market capital O STO billion. According to the estimated regression equation, many lists would low this company were not included in the S&P Sodex and how many w olow it were cluded in the index Ein Problems using the sample, we estimated the netficient on the size variable as 0 3199 26 in the show regreso D ewe there is an inconsistency in the results PROBLEM 3 BACKGROUND INFO There is substantial cross-sectional variation in the number of financial analysts who follow a company. Suppose you hypothesize that a company's site (market cap) and financial risk (debt-to-equity ratios) influence the number of financial analysts who follow a company. You formulate the following regression model: (Analyst following) - bo + by Size + b}(D/E), + & where (Analyst following), the natural log of (1 r), where is the number of analysts following company i Size - the natural log of the market capitalization of company i in millions of dollars (D/E), -the debt-to-equity ratio for company i In the definition of Analyst following. I is added to the number of analysts following a company because some companies are not followed by any analysts, and the natural log of is indeterminate. The following table gives the coeff cient estimates of the above regression model for a randomly selected sample of 500 companies. The data are for the year 2002 Coefficient Estimates from Regressing Analyst Following on Size and Debt-to- Equity Ratio Coefficient t-Statistic Standard Error Intercept 0.1080 -2.633 0.2845 0.3199 0.0152 210161 DIE -0.1895 06.20 3055 Set Call A Consider two companies, both of which have a debt-to-equity ratio of 075 The first company has a market capitalization of S100 million, and the sec ond company has a market capitalization of Sibillion based on the above estimates, how many more analysts will follow the second company than the first company? Suppose the p-value reported for the estimated coellicient on (D/E), 0.00236 State the interpretation of 0.00236 PROBLEME 4 (ON NEXT PICTURE) - ONLY ANSWER24 Problem 3 addressed the cross-sectional variation in the number of financial analysts who follow a company. In that problem, company size and debt-to- equity ratios were the Independent variables. You receive a suggestion that membership in the S&P 500 Index should be added to the model as a third independent variable, the hypothesis is that there is greater demand for analyst coverage for stocks included in the S&P 500 because of the widespread use of the S&P 500 as a benchmark. Write a multiple regression equation to test whether analyst following is systematically higher for companies included in the S&P 500 Index. Also include company size and debt-to-equity ratio in this equation. Use the notations below. (Analyst following), - natural log of (1 + Number of analysts following company ) Size, natural log of the market capitalization of com- pany fin millions of dollars (D/E), - debt-to-equity ratio for company i S&P, - inclusion of company i in the S&P 500 Index (1 if included, if not included) B In the above specification for analyst following. I is added to the number of analysts following a company because some companies are not followed by any analyst, and the natural log of is indeterminate State the appropriate null hypothesis and alternative hypothesis in a two- sided test of significance of the dummy variable The following table gives estimates of the coefficients of the above regres. sion model for a randomly selected sample of 500 companies. The data are for the year 2002. Determine whether you can reject the null hypothesis at the 0.05 significance level (in a two-sided test of significance) ( Coefficient Estimates from Regressing Analyst Following on Size, Debt-to-Equity Ratio, and S&P 500 Membership, 2002 Coefficient Standard Error -Statistic Intercept -0.0075 0.1218 -0.0616 Size 0.2648 0.0191 (DIE), -0.1829 00608 -30032 S&P 01218 00019 500 Source is the out D Considera company with a debt te equity ratio of 12 and a market capital O STO billion. According to the estimated regression equation, many lists would low this company were not included in the S&P Sodex and how many w olow it were cluded in the index Ein Problems using the sample, we estimated the netficient on the size variable as 0 3199 26 in the show regreso D ewe there is an inconsistency in the results
Step by Step Solution
There are 3 Steps involved in it

Get step-by-step solutions from verified subject matter experts