

Question: please answer Q0a - Q5b 38 ####### A: up 1 degree, B: up 13 degrees, C: up by 1%, D: up 13%, E: down 12%
please answer Q0a - Q5b
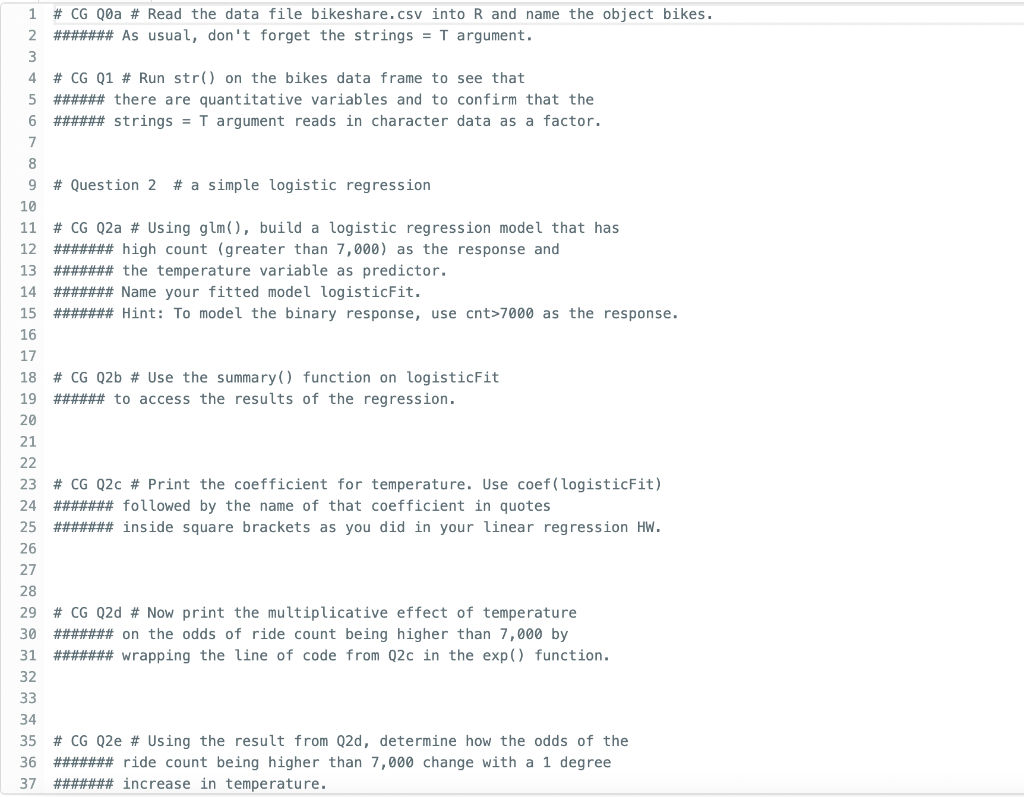
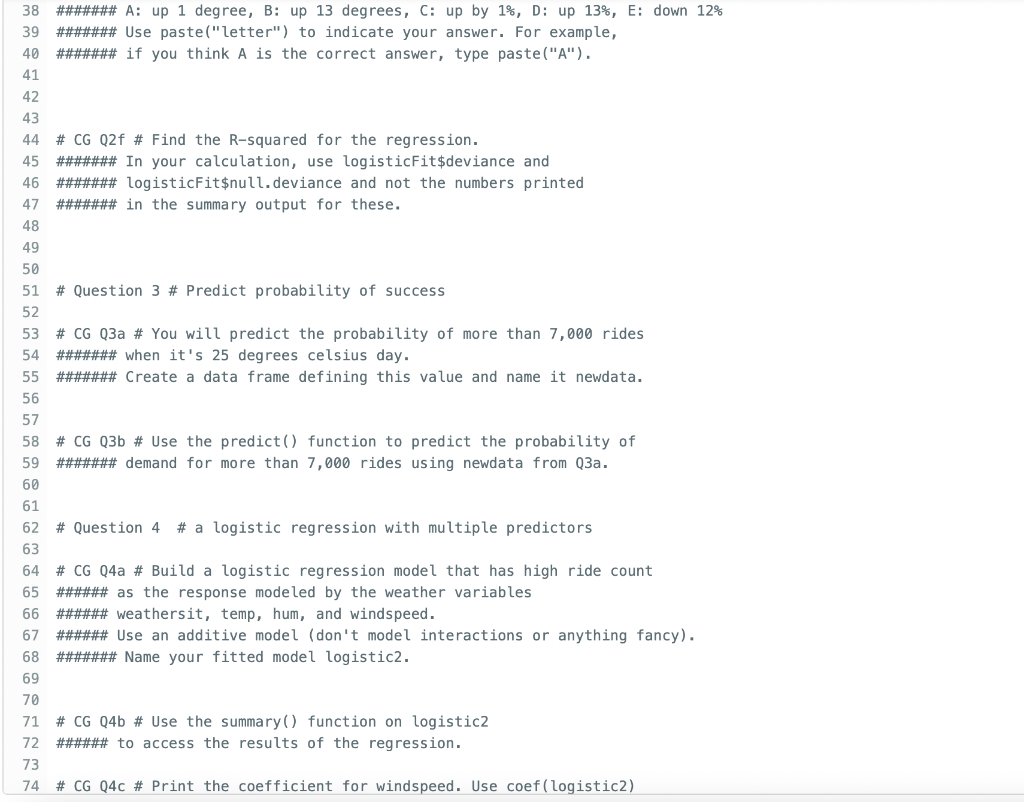
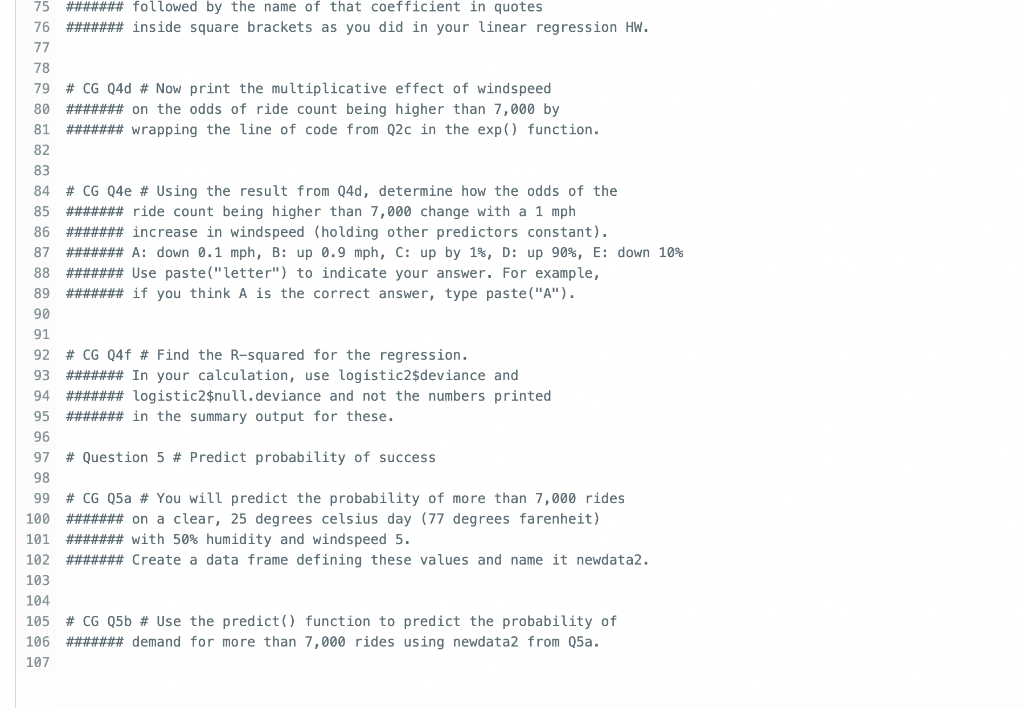
38 \#\#\#\#\#\#\# A: up 1 degree, B: up 13 degrees, C: up by 1%, D: up 13\%, E: down 12% 39 \#\#\#\#\#\#\# Use paste("letter") to indicate your answer. For example, 40 \#\#\#\#\#\#\# if you think A is the correct answer, type paste("A"). 41 42 43 44 \# CG Q2f \# Find the R-squared for the regression. 45 \#\#\#\#\#\#\# In your calculation, use logisticFit\$deviance and 46 \#\#\#\#\#\#\# logisticFit\$null. deviance and not the numbers printed 47 \#\#\#\#\#\#\# in the summary output for these. 48 49 50 51 \# Question 3 \# Predict probability of success 52 53 \# CG Q3a \# You will predict the probability of more than 7,000 rides 54 \#\#\#\#\#\#\# when it's 25 degrees celsius day. 55 \#\#\#\#\#\# Create a data frame defining this value and name it newdata. 56 57. 58 \# CG Q3b \# Use the predict() function to predict the probability of 59 \#\#\#\#\#\# demand for more than 7,000 rides using newdata from Q3a. 60 61 62 \# Question 4 \# a logistic regression with multiple predictors 63 64 \# CG Q4a \# Build a logistic regression model that has high ride count 65 \#\#\#\#\#\# as the response modeled by the weather variables 66 \#\#\#\#\# weathersit, temp, hum, and windspeed. 67 \#\#\#\#\#\# Use an additive model (don't model interactions or anything fancy). 68 \#\#\#\#\#\# Name your fitted model logistic2. 69 70 71 \# CG Q4b \# Use the summary() function on logistic2 72 \#\#\#\#\#\# to access the results of the regression. 73 74# CG Q4C \# Print the coefficient for windspeed. Use coef(logistic2) 75 \#\#\#\#\#\#\# followed by the name of that coefficient in quotes 76 \#\#\#\#\#\#\# inside square brackets as you did in your linear regression HW. \# CG Q4d \# Now print the multiplicative effect of windspeed \#\#\#\#\#\# on the odds of ride count being higher than 7,000 by \#\#\#\#\#\#\# wrapping the line of code from Q2c in the exp() function. \# CG Q4e \# Using the result from Q4d, determine how the odds of the \#\#\#\#\#\#\# ride count being higher than 7,000 change with a 1mph \#\#\#\#\#\#\# increase in windspeed (holding other predictors constant). \#\#\#\#\#\#\# A: down 0.1mph, B: up 0.9mph,C: up by 1%,D : up 90%,E : down 10% \#\#\#\#\#\#\# Use paste("letter") to indicate your answer. For example, \#\#\#\#\#\#\#\# if you think A is the correct answer, type paste("A"). \# CG Q4f \# Find the R-squared for the regression. \#\#\#\#\#\#\# In your calculation, use logistic2\$deviance and \#\#\#\#\#\#\# logistic2\$null. deviance and not the numbers printed \#\#\#\#\#\#\# in the summary output for these. \# Question 5 \# Predict probability of success \# CG Q5a \# You will predict the probability of more than 7,000 rides \#\#\#\#\#\# on a clear, 25 degrees celsius day (77 degrees farenheit) \#\#\#\#\#\#\# with 50% humidity and windspeed 5. \#\#\#\#\#\#\# Create a data frame defining these values and name it newdata2. \# CG Q5b \# Use the predict() function to predict the probability of \#\#\#\#\#\# demand for more than 7,000 rides using newdata2 from Q5a
Step by Step Solution
There are 3 Steps involved in it

Get step-by-step solutions from verified subject matter experts