

Question: Please answer Q3 using R language in as fewer steps as possible If you choose to use Python, you will have to use R to
Please answer Q3 using R language in as fewer steps as possible
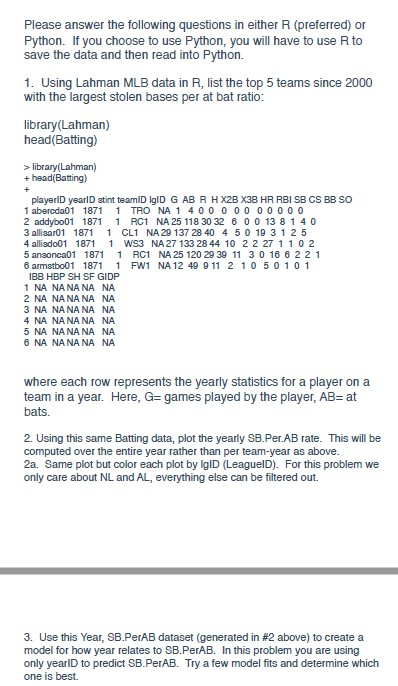
If you choose to use Python, you will have to use R to save the data and then read into Python. Using Lahman MLB data in R, list the top 5 teams since 2000 with the largest stolen bases per at bat ratio: library(Lahman) head(Batting) > library(Lahman) + head(Batting) + playerID yearID stint teamID IgID G AB R H X2B X3B HR RBI SB CS BB SO 1 abercda01 1871 1 TRO NA 1 4 0 0 0 0 0 0 0 0 0 0 2 addybo01 1871 1 RC1 NA 25 118 30 32 6 0 0 13 8 1 4 0 3 allisar01 1871 1 CL1 NA 29 137 28 40 4 5 0 19 3 1 2 5 4 allisdo01 1871 1 WS3 NA 27 133 28 44 10 2 2 27 1 1 0 2 5 ansonca01 1871 1 RC1 NA 25 120 29 39 11 3 0 16 6 2 2 6 armstbo01 1871 1 FW1 NA 12 49 9 11 2 1 0 5 0 1 0 1 IBB HBP SH SF GIDP 1 NA NA NA NA NA 2 NA NA NA NA NA 3 NA NA NA NA NA 4 NA NA NA NA NA 5 NA NA NA NA NA 6 NA NA NA NA NA where each row represents the yearly statistics for a player on a team in a year. Here, G= games played by the player, AB= at bats. Using this same Batting data, plot the yearly SB.Per AB rate. This will be computed over the entire year rather than per team-year as above. Same plot but color each plot by IgID (LeagueID). For this problem we only care about NL and AL, everything else can be filtered out
Step by Step Solution
There are 3 Steps involved in it

Get step-by-step solutions from verified subject matter experts