

Question: Please answer question 1 and 2 Mr. Aristotle is a Vice President at Bayou City Real Estate Investment Trust (REIT) and he has presented a
 Please answer question 1 and 2
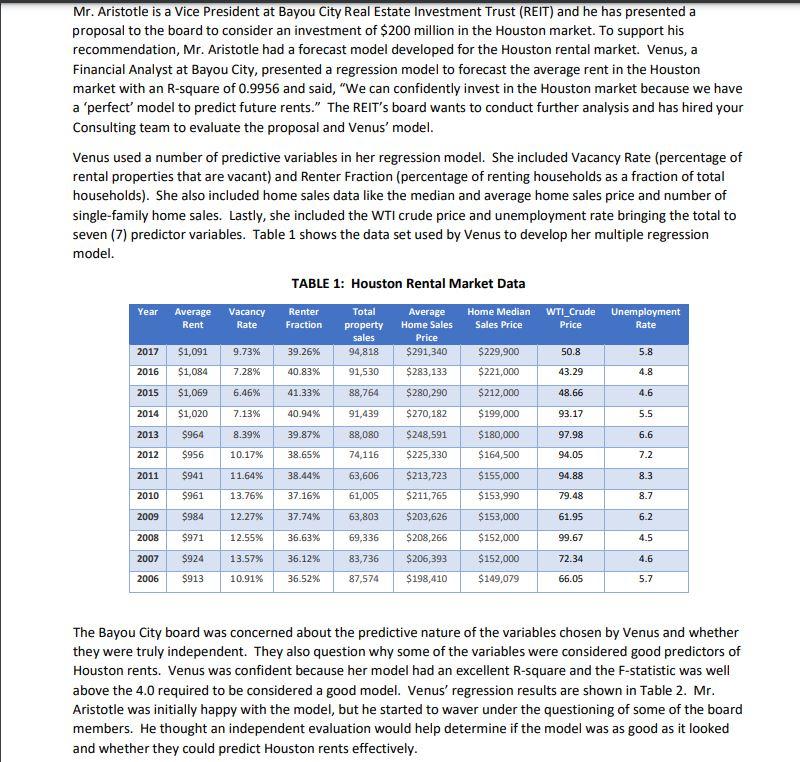
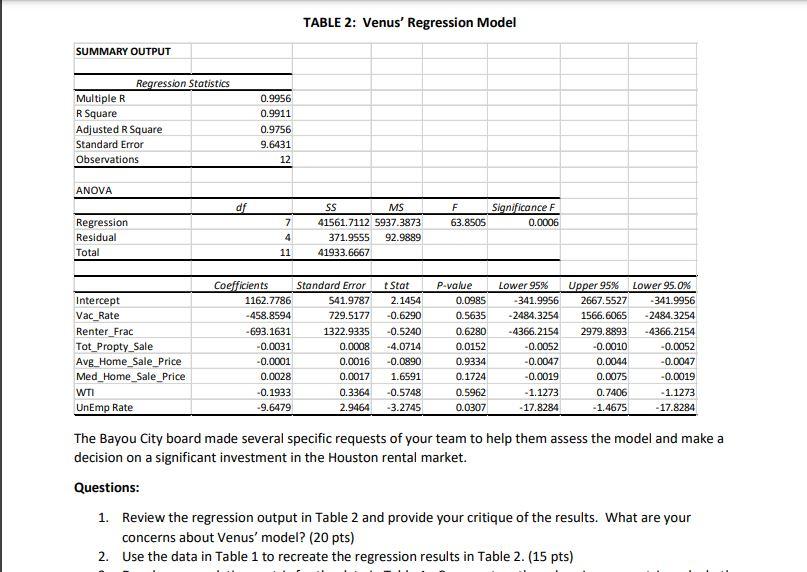
Mr. Aristotle is a Vice President at Bayou City Real Estate Investment Trust (REIT) and he has presented a proposal to the board to consider an investment of $200 million in the Houston market. To support his recommendation, Mr. Aristotle had a forecast model developed for the Houston rental market. Venus, a Financial Analyst at Bayou City, presented a regression model to forecast the average rent in the Houston market with an R-square of 0.9956 and said, "We can confidently invest in the Houston market because we have a 'perfect' model to predict future rents." The REIT's board wants to conduct further analysis and has hired your Consulting team to evaluate the proposal and Venus' model. Venus used a number of predictive variables in her regression model. She included Vacancy Rate (percentage of rental properties that are vacant) and Renter Fraction (percentage of renting households as a fraction of total households). She also included home sales data like the median and average home sales price and number of single-family home sales. Lastly, she included the WTI Crude price and unemployment rate bringing the total to seven (7) predictor variables. Table 1 shows the data set used by Venus to develop her multiple regression model. TABLE 1: Houston Rental Market Data Year Average Rent Vacancy Rate Renter Fraction Total property sales 94,818 Home Median WTI_Crude Unemployment Sales Price Price Rate Average Home Sales Price $291,340 $283,133 2017 $1,091 9.73% 39.26% 50.8 5.8 2016 $1,084 7.28% 40.83% 91,530 $229,900 $221,000 $212,000 43.29 4.8 2015 $1,069 6.46% 41.33% 48.66 4.6 88,764 91,439 $280,290 $270,182 2014 $1,020 7.13% 40.94% $199,000 93.17 5.5 2013 $964 8.39% 39.87% 88,080 $248,591 97.98 6.6 2012 $956 10.17% 38.65% 74,116 94.05 7.2 $225,330 $213,723 2011 $941 11.64% 38.4496 $180,000 $164,500 $155,000 $153,990 $153,000 94.88 63,606 61,005 8.3 2010 $961 13.76% 37.16% $211,765 79.48 8.7 2009 $984 12.27% 37.74% 63,803 $203,626 61.95 6.2 2008 $971 12.55% 36.63% 69,336 $208,266 $152,000 99.67 4.5 2007 $924 13.57% 36.12% $206,393 72.34 4.6 83,736 87,574 $152,000 $149,079 2006 $913 10.91% 36.52% $198,410 66.05 5.7 The Bayou City board was concerned about the predictive nature of the variables chosen by Venus and whether they were truly independent. They also question why some of the variables were considered good predictors of Houston rents. Venus was confident because her model had an excellent R-square and the F-statistic was well above the 4.0 required to be considered a good model. Venus' regression results are shown in Table 2. Mr. Aristotle was initially happy with the model, but he started to waver under the questioning of some of the board members. He thought an independent evaluation would help determine if the model was as good as it looked and whether they could predict Houston rents effectively. TABLE 2: Venus' Regression Model SUMMARY OUTPUT Regression Statistics Multiple R R Square Adjusted R Square Standard Error Observations 0.9956 0.9911 0.9756 9.6431 12 ANOVA df F Significance F 63.8505 0.0006 Regression Residual Total 7 4 11 SS MS 41561.7112 5937.3873 371.9555 92.9889 41933.6667 Intercept Vac_Rate Renter_Frac Tot_Propty_Sale Avg_Home_Sale_Price Med_Home_Sale_Price WTI UnEmp Rate Coefficients 1162.7786 -458.8594 -693.1631 -0.0031 -0.0001 0.0028 -0.1933 -9.6479 Standard Error 541.9787 729.5177 1322.9335 0.0008 0.0016 0.0017 0.3364 2.9464 Stat 2.1454 -0.6290 -0.5240 -4.0714 -0.0890 1.6591 -0.5748 -3.2745 P-value 0.0985 0.5635 0.6280 0.0152 0.9334 0.1724 0.5962 0.0307 Lower 95% -341.9956 -2484.3254 -4366.2154 -0.0052 -0.0047 -0.0019 - 1.1273 - 17.8284 Upper 95% Lower 95.0% 2667.5527 -341.9956 1566.6065 -2484.3254 2979.8893 -4366.2154 -0.0010 -0.0052 0.0044 -0.0047 0.0075 -0.0019 0.7406 - 1.1273 -1.4675 - 17.8284 The Bayou City board made several specific requests of your team to help them assess the model and make a decision on a significant investment in the Houston rental market. Questions: 1. Review the regression output in Table 2 and provide your critique of the results. What are your concerns about Venus' model? (20 pts) 2. Use the data in Table 1 to recreate the regression results in Table 2. (15 pts) Mr. Aristotle is a Vice President at Bayou City Real Estate Investment Trust (REIT) and he has presented a proposal to the board to consider an investment of $200 million in the Houston market. To support his recommendation, Mr. Aristotle had a forecast model developed for the Houston rental market. Venus, a Financial Analyst at Bayou City, presented a regression model to forecast the average rent in the Houston market with an R-square of 0.9956 and said, "We can confidently invest in the Houston market because we have a 'perfect' model to predict future rents." The REIT's board wants to conduct further analysis and has hired your Consulting team to evaluate the proposal and Venus' model. Venus used a number of predictive variables in her regression model. She included Vacancy Rate (percentage of rental properties that are vacant) and Renter Fraction (percentage of renting households as a fraction of total households). She also included home sales data like the median and average home sales price and number of single-family home sales. Lastly, she included the WTI Crude price and unemployment rate bringing the total to seven (7) predictor variables. Table 1 shows the data set used by Venus to develop her multiple regression model. TABLE 1: Houston Rental Market Data Year Average Rent Vacancy Rate Renter Fraction Total property sales 94,818 Home Median WTI_Crude Unemployment Sales Price Price Rate Average Home Sales Price $291,340 $283,133 2017 $1,091 9.73% 39.26% 50.8 5.8 2016 $1,084 7.28% 40.83% 91,530 $229,900 $221,000 $212,000 43.29 4.8 2015 $1,069 6.46% 41.33% 48.66 4.6 88,764 91,439 $280,290 $270,182 2014 $1,020 7.13% 40.94% $199,000 93.17 5.5 2013 $964 8.39% 39.87% 88,080 $248,591 97.98 6.6 2012 $956 10.17% 38.65% 74,116 94.05 7.2 $225,330 $213,723 2011 $941 11.64% 38.4496 $180,000 $164,500 $155,000 $153,990 $153,000 94.88 63,606 61,005 8.3 2010 $961 13.76% 37.16% $211,765 79.48 8.7 2009 $984 12.27% 37.74% 63,803 $203,626 61.95 6.2 2008 $971 12.55% 36.63% 69,336 $208,266 $152,000 99.67 4.5 2007 $924 13.57% 36.12% $206,393 72.34 4.6 83,736 87,574 $152,000 $149,079 2006 $913 10.91% 36.52% $198,410 66.05 5.7 The Bayou City board was concerned about the predictive nature of the variables chosen by Venus and whether they were truly independent. They also question why some of the variables were considered good predictors of Houston rents. Venus was confident because her model had an excellent R-square and the F-statistic was well above the 4.0 required to be considered a good model. Venus' regression results are shown in Table 2. Mr. Aristotle was initially happy with the model, but he started to waver under the questioning of some of the board members. He thought an independent evaluation would help determine if the model was as good as it looked and whether they could predict Houston rents effectively. TABLE 2: Venus' Regression Model SUMMARY OUTPUT Regression Statistics Multiple R R Square Adjusted R Square Standard Error Observations 0.9956 0.9911 0.9756 9.6431 12 ANOVA df F Significance F 63.8505 0.0006 Regression Residual Total 7 4 11 SS MS 41561.7112 5937.3873 371.9555 92.9889 41933.6667 Intercept Vac_Rate Renter_Frac Tot_Propty_Sale Avg_Home_Sale_Price Med_Home_Sale_Price WTI UnEmp Rate Coefficients 1162.7786 -458.8594 -693.1631 -0.0031 -0.0001 0.0028 -0.1933 -9.6479 Standard Error 541.9787 729.5177 1322.9335 0.0008 0.0016 0.0017 0.3364 2.9464 Stat 2.1454 -0.6290 -0.5240 -4.0714 -0.0890 1.6591 -0.5748 -3.2745 P-value 0.0985 0.5635 0.6280 0.0152 0.9334 0.1724 0.5962 0.0307 Lower 95% -341.9956 -2484.3254 -4366.2154 -0.0052 -0.0047 -0.0019 - 1.1273 - 17.8284 Upper 95% Lower 95.0% 2667.5527 -341.9956 1566.6065 -2484.3254 2979.8893 -4366.2154 -0.0010 -0.0052 0.0044 -0.0047 0.0075 -0.0019 0.7406 - 1.1273 -1.4675 - 17.8284 The Bayou City board made several specific requests of your team to help them assess the model and make a decision on a significant investment in the Houston rental market. Questions: 1. Review the regression output in Table 2 and provide your critique of the results. What are your concerns about Venus' model? (20 pts) 2. Use the data in Table 1 to recreate the regression results in Table 2. (15 pts)
Step by Step Solution
There are 3 Steps involved in it

Get step-by-step solutions from verified subject matter experts