

Question: Please answer Question 1 in excel and provide a detailed explanation! Thank you CASE STUDY Managing Inventories at ALKO Inc. ALKO began in 1943 in
Please answer Question 1 in excel and provide a detailed explanation! Thank you
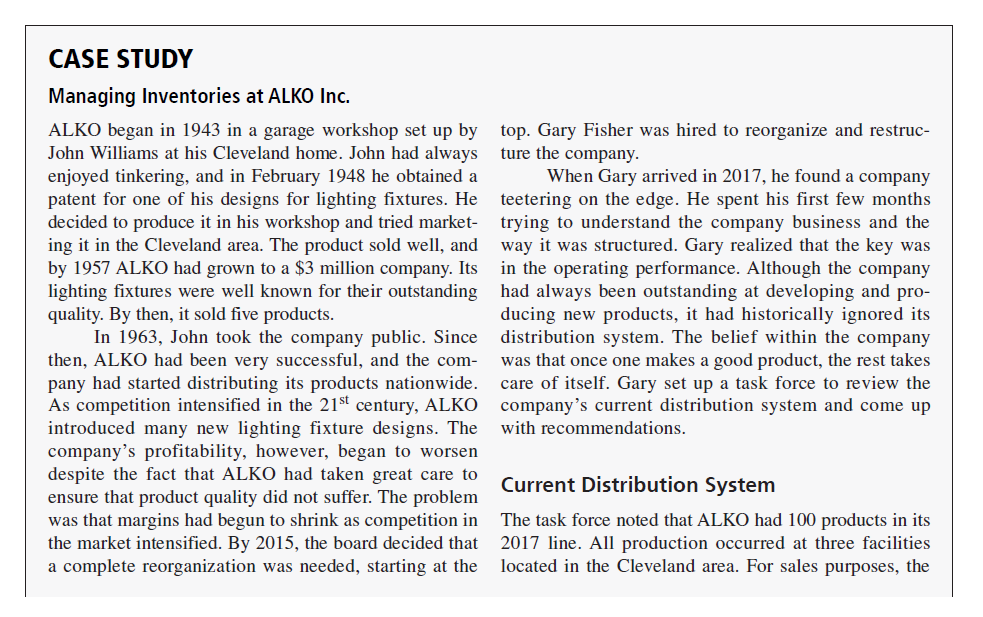
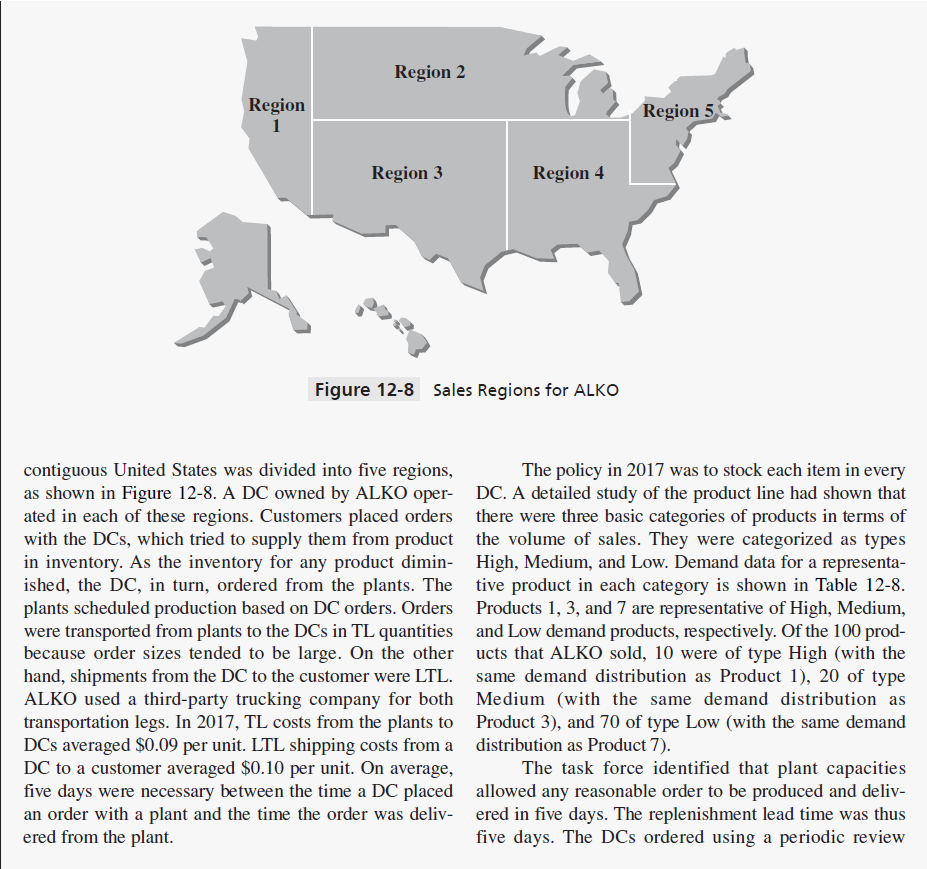
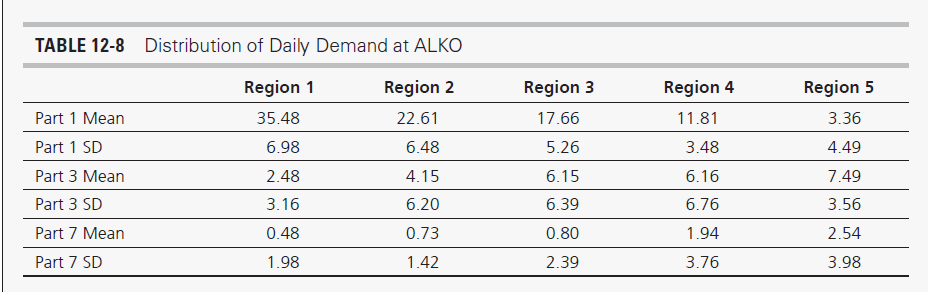
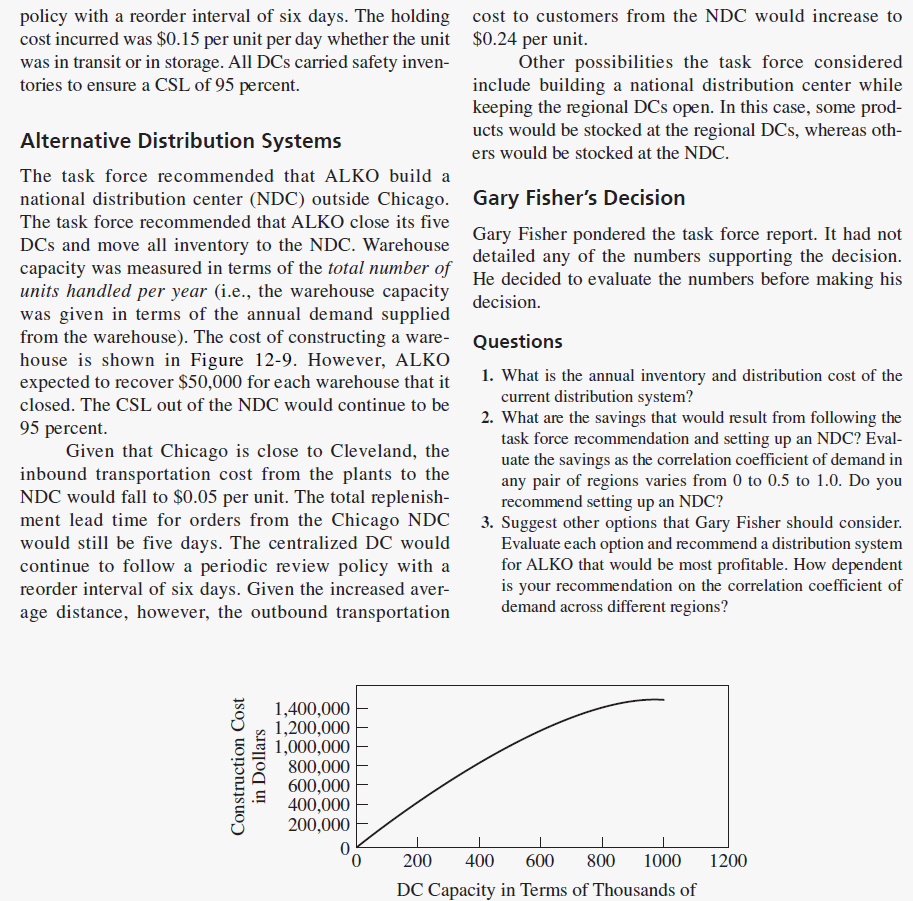
CASE STUDY Managing Inventories at ALKO Inc. ALKO began in 1943 in a garage workshop set up by top. Gary Fisher was hired to reorganize and restruc- John Williams at his Cleveland home. John had always ture the company. enjoyed tinkering, and in February 1948 he obtained a When Gary arrived in 2017, he found a company a patent for one of his designs for lighting fixtures. He teetering on the edge. He spent his first few months decided to produce it in his workshop and tried market- trying to understand the company business and the ing it in the Cleveland area. The product sold well, and way it was structured. Gary realized that the key was by 1957 ALKO had grown to a $3 million company. Its in the operating performance. Although the company lighting fixtures were well known for their outstanding had always been outstanding at developing and pro- quality. By then, it sold five products. ducing new products, it had historically ignored its In 1963, John took the company public. Since distribution system. The belief within the company then, ALKO had been very successful, and the com- was that once one makes a good product, the rest takes pany had started distributing its products nationwide. care of itself. Gary set up a task force to review the As competition intensified in the 21st century, ALKO company's current distribution system and come up introduced many new lighting fixture designs. The with recommendations. company's profitability, however, began to worsen despite the fact that ALKO had taken great care to Current Distribution System ensure that product quality did not suffer. The problem was that margins had begun to shrink as competition in The task force noted that ALKO had 100 products in its the market intensified. By 2015, the board decided that 2017 line. All production occurred at three facilities a complete reorganization was needed, starting at the located in the Cleveland area. For sales purposes, the Region 2 Region 1 Region 5 Region 3 Region 4 Figure 12-8 Sales Regions for ALKO contiguous United States was divided into five regions, The policy in 2017 was to stock each item in every as shown in Figure 12-8. A DC owned by ALKO oper- DC. A detailed study of the product line had shown that ated in each of these regions. Customers placed orders there were three basic categories of products in terms of with the DCs, which tried to supply them from product the volume of sales. They were categorized as types in inventory. As the inventory for any product dimin- High, Medium, and Low. Demand data for a representa- ished, the DC, in turn, ordered from the plants. The tive product in each category is shown in Table 12-8. plants scheduled production based on DC orders. Orders Products 1, 3, and 7 are representative of High, Medium, were transported from plants to the DCs in TL quantities and Low demand products, respectively. Of the 100 prod- because order sizes tended to be large. On the other ucts that ALKO sold, 10 were of type High (with the hand, shipments from the DC to the customer were LTL. same demand distribution as Product 1), 20 of type ALKO used a third-party trucking company for both Medium (with the same demand distribution as transportation legs. In 2017, TL costs from the plants to Product 3), and 70 of type Low (with the same demand DCs averaged $0.09 per unit. LTL shipping costs from a distribution as Product 7). DC to a customer averaged $0.10 per unit. On average, The task force identified that plant capacities five days were necessary between the time a DC placed allowed any reasonable order to be produced and deliv- an order with a plant and the time the order was deliv- ered in five days. The replenishment lead time was thus ered from the plant. five days. The DCs ordered using a periodic review TABLE 12-8 Distribution of Daily Demand at ALKO Region 3 Region 1 35.48 Region 2 22.61 Region 4 11.81 Region 5 3.36 17.66 6.98 6.48 5.26 3.48 4.49 4.15 6.16 7.49 Part 1 Mean Part 1 SD Part 3 Mean Part 3 SD Part 7 Mean Part 7 SD 2.48 3.16 0.48 6.15 6.39 6.20 6.76 3.56 0.73 0.80 1.94 2.54 1.98 1.42 2.39 3.76 3.98 policy with a reorder interval of six days. The holding cost to customers from the NDC would increase to cost incurred was $0.15 per unit per day whether the unit $0.24 per unit. was in transit or in storage. All DCs carried safety inven- Other possibilities the task force considered tories to ensure a CSL of 95 percent. include building a national distribution center while keeping the regional DCs open. In this case, some prod- Alternative Distribution Systems ucts would be stocked at the regional DCs, whereas oth- ers would be stocked at the NDC. The task force recommended that ALKO build a national distribution center (NDC) outside Chicago. Gary Fisher's Decision The task force recommended that ALKO close its five Gary Fisher pondered the task force report. It had not DCs and move all inventory to the NDC. Warehouse detailed any of the numbers supporting the decision. capacity was measured in terms of the total number of He decided to evaluate the numbers before making his units handled per year (i.e., the warehouse capacity decision. was given in terms of the annual demand supplied from the warehouse). The cost of constructing a ware- Questions house is shown in Figure 12-9. However, ALKO expected to recover $50,000 for each warehouse that it 1. What is the annual inventory and distribution cost of the closed. The CSL out of the NDC would continue to be current distribution system? 95 percent. 2. What are the savings that would result from following the task force recommendation and setting up an NDC? Eval- Given that Chicago is close to Cleveland, the uate the savings as the correlation coefficient of demand in inbound transportation cost from the plants to the any pair of regions varies from 0 to 0.5 to 1.0. Do you NDC would fall to $0.05 per unit. The total replenish- recommend setting up an NDC? ment lead time for orders from the Chicago NDC 3. Suggest other options that Gary Fisher should consider. would still be five days. The centralized DC would Evaluate each option and recommend a distribution system continue to follow a periodic review policy with a for ALKO that would be most profitable. How dependent reorder interval of six days. Given the increased aver- is your recommendation on the correlation coefficient of age distance, however, the outbound transportation demand across different regions? Construction Cost in Dollars 1,400,000 1,200,000 1,000,000 800,000 600,000 400,000 200,000 0 1200 200 400 600 800 1000 DC Capacity in Terms of Thousands ofStep by Step Solution
There are 3 Steps involved in it
1 Expert Approved Answer
Step: 1 Unlock

Question Has Been Solved by an Expert!
Get step-by-step solutions from verified subject matter experts
Step: 2 Unlock
Step: 3 Unlock