

Question: please answer question 12 This code will plot the decision boundary with respect to the data. The plot will include PetalLengthCm in the X-axis and
please answer question 12
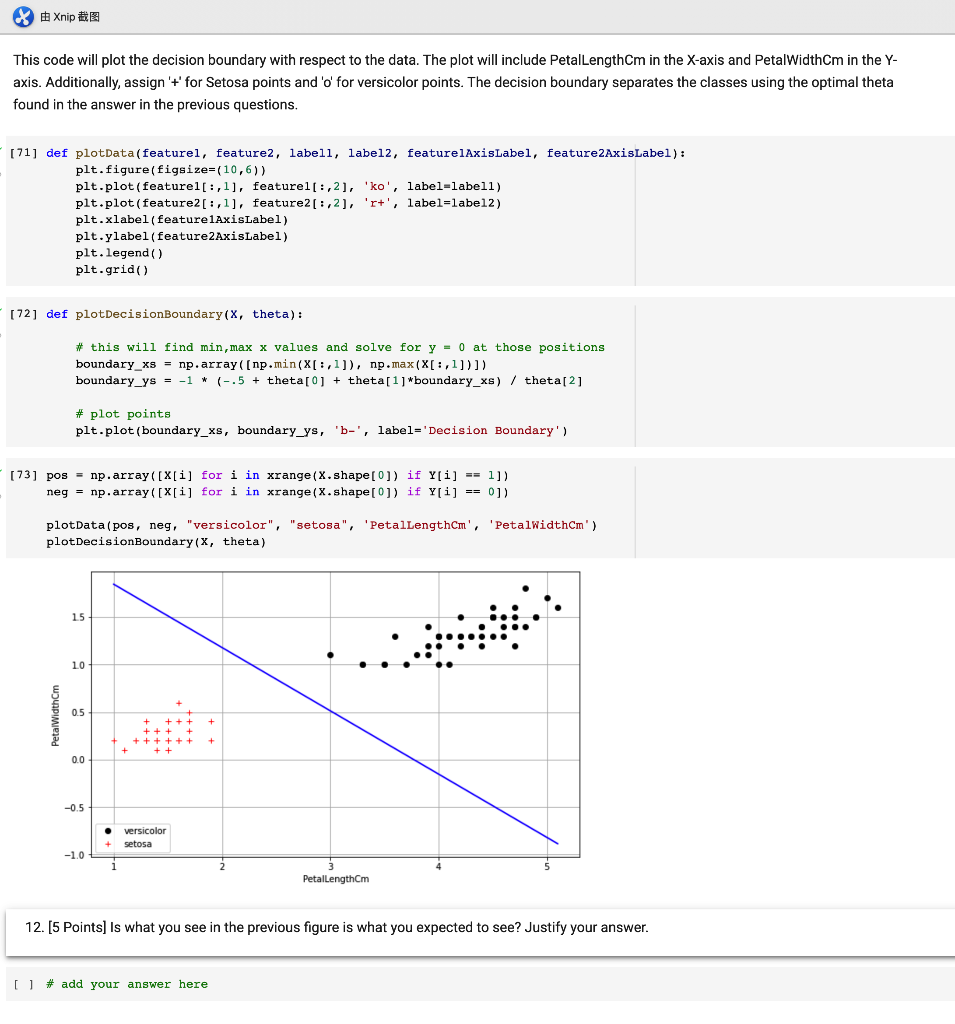
This code will plot the decision boundary with respect to the data. The plot will include PetalLengthCm in the X-axis and PetalWidthCm in the Y axis. Additionally, assign ' + ' for Setosa points and 'o' for versicolor points. The decision boundary separates the classes using the optimal theta found in the answer in the previous questions. [71] def plotdata(featurel, feature2, labell, label2, featurelAxislabel, feature2Axislabel): plt.figure(figsize (10,6) ) plt.plot (feature1 [:,1], feature [:,2], 'ko', label=label1) plt.plot (feature2 [:,1], feature2 [:,2], 'r+', label=label2) plt.xlabel (feature1Axistabel) plt.ylabel (feature2Axistabel) plt. legend () plt.grid() [72] def plotDecisionBoundary(x, theta): \# this will find min, maxx values and solve for y=0 at those positions boundary_xs =nparray([npmin(X[:,1]),npmax(X[:,1])]) boundary_ys =1(.5+ theta [0]+ theta[1]*boundary_xs )/ theta[2] \# plot points plt.plot (boundary_xs, boundary_ys, 'b-', label='Decision Boundary') [73] pos = np.array ([X[i] for i in xrange (X. shape [0]) if Y[i]==1]) neg = np.array ([X[i] for i in xrange (X. shape[0]) if Y[i]==0]) plotData(pos, neg, "versicolor", "setosa", 'PetallengthCm', 'PetalWidthCm') plotDecisionBoundary(X, theta) 12. [5 Points] Is what you see in the previous figure is what you expected to see? Justify your
Step by Step Solution
There are 3 Steps involved in it

Get step-by-step solutions from verified subject matter experts